Adaboost for Regression - Example
- 10 minutes read - 1953 wordsIntroduction
AdaBoost is an ensemble model that sequentially builds new models based on the errors of the previous model to improve the predictions. The most common case is to use Decision Trees as base models. Very often the examples explained are for classification tasks. AdaBoost can, however, also be used for regression problems. This is what we will focus on in this post. This article covers the detailed calculations of a simplified example. For a general explanation of the algorithm, please refer to AdaBoost - Explained.
Data
We use a very simplified example dataset to make the development of the model by hand easier. We use a dataset containing 10 samples. It includes the features ‘age’, ’likes height’, and ’likes goats’. The target variable is ‘climbed meters’. That is we want to estimate how many meters a person has climbed depending on their age, and whether they like height and goats. For comparison purposes, we used that same dataset in the article Decision Trees for Regression - Example.
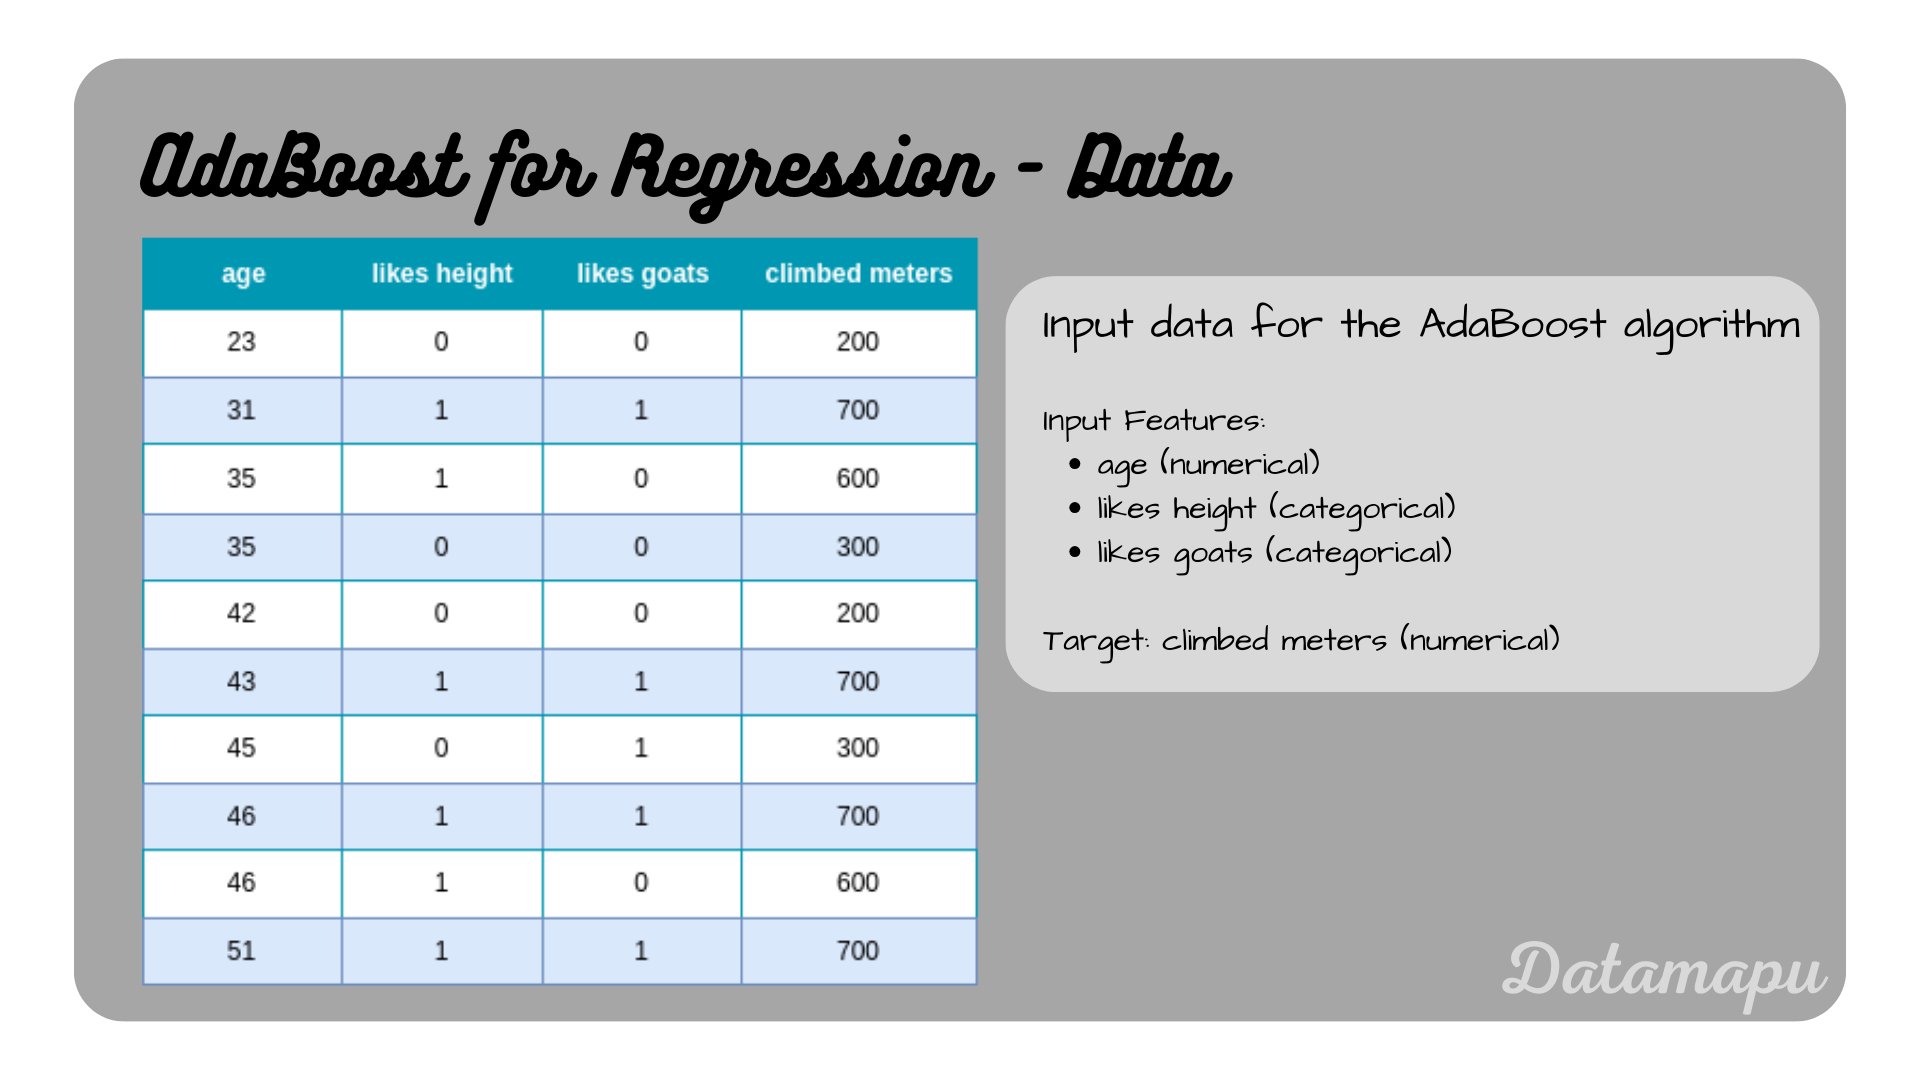 The dataset used in this example.
Build the Model
We build a AdaBoost model from scratch using the above dataset. We use the default values from in sklearn, that is we use Decision Trees as underlying models with a maximum depth of three. In this post, however, we will focus on AdaBoost and not on the development of the Decision Trees. To understand the details on how to develop a Decision Tree for a regression task, please refer to the separate articles Decision Trees - Explained or Decision Trees for Regression - Example.
We start with asigning weights to each sample. Initially, the weights are all equal to $\frac{1}{N}$, with $N$ the number of data samples, that is in our case the initial weights are $0.1$ for all samples.
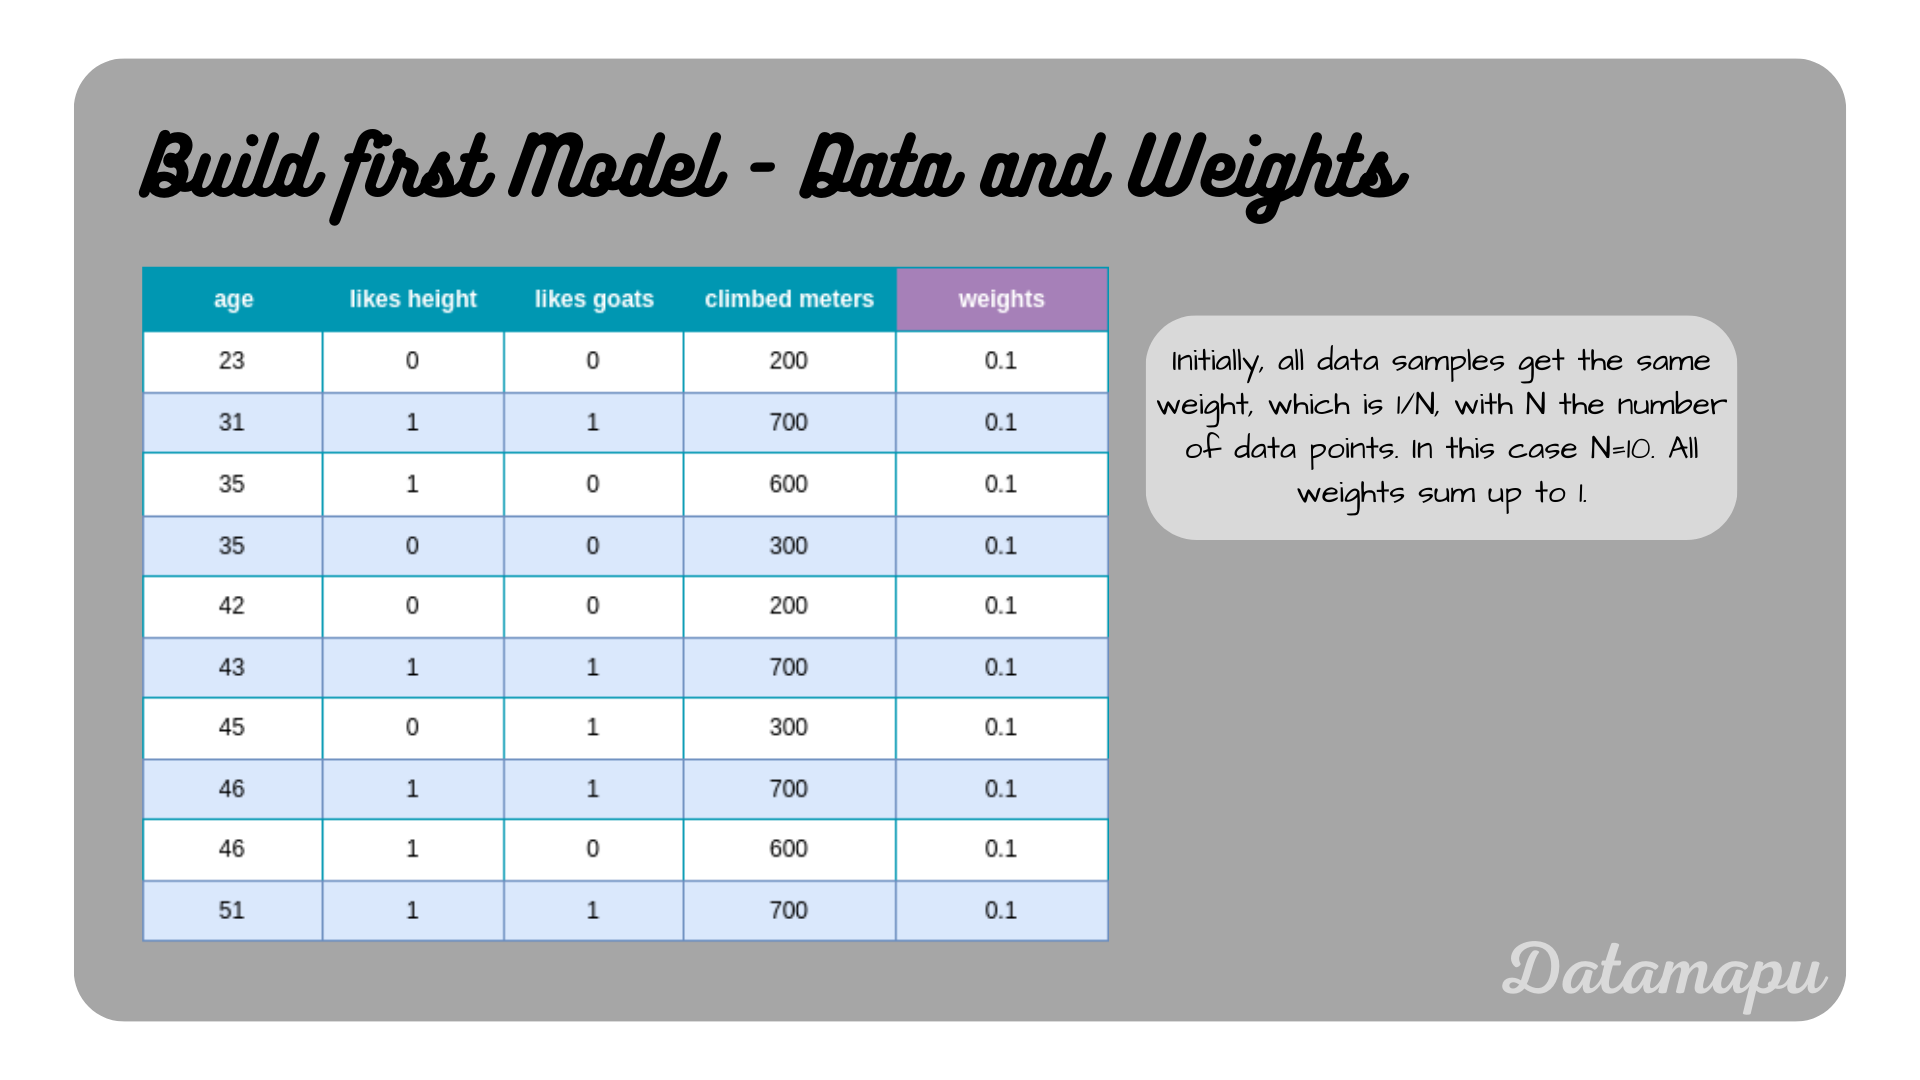 The dataset with weights assigned to each sample.
We now fit a Decision Tree with maximum depth of three to this dataset.
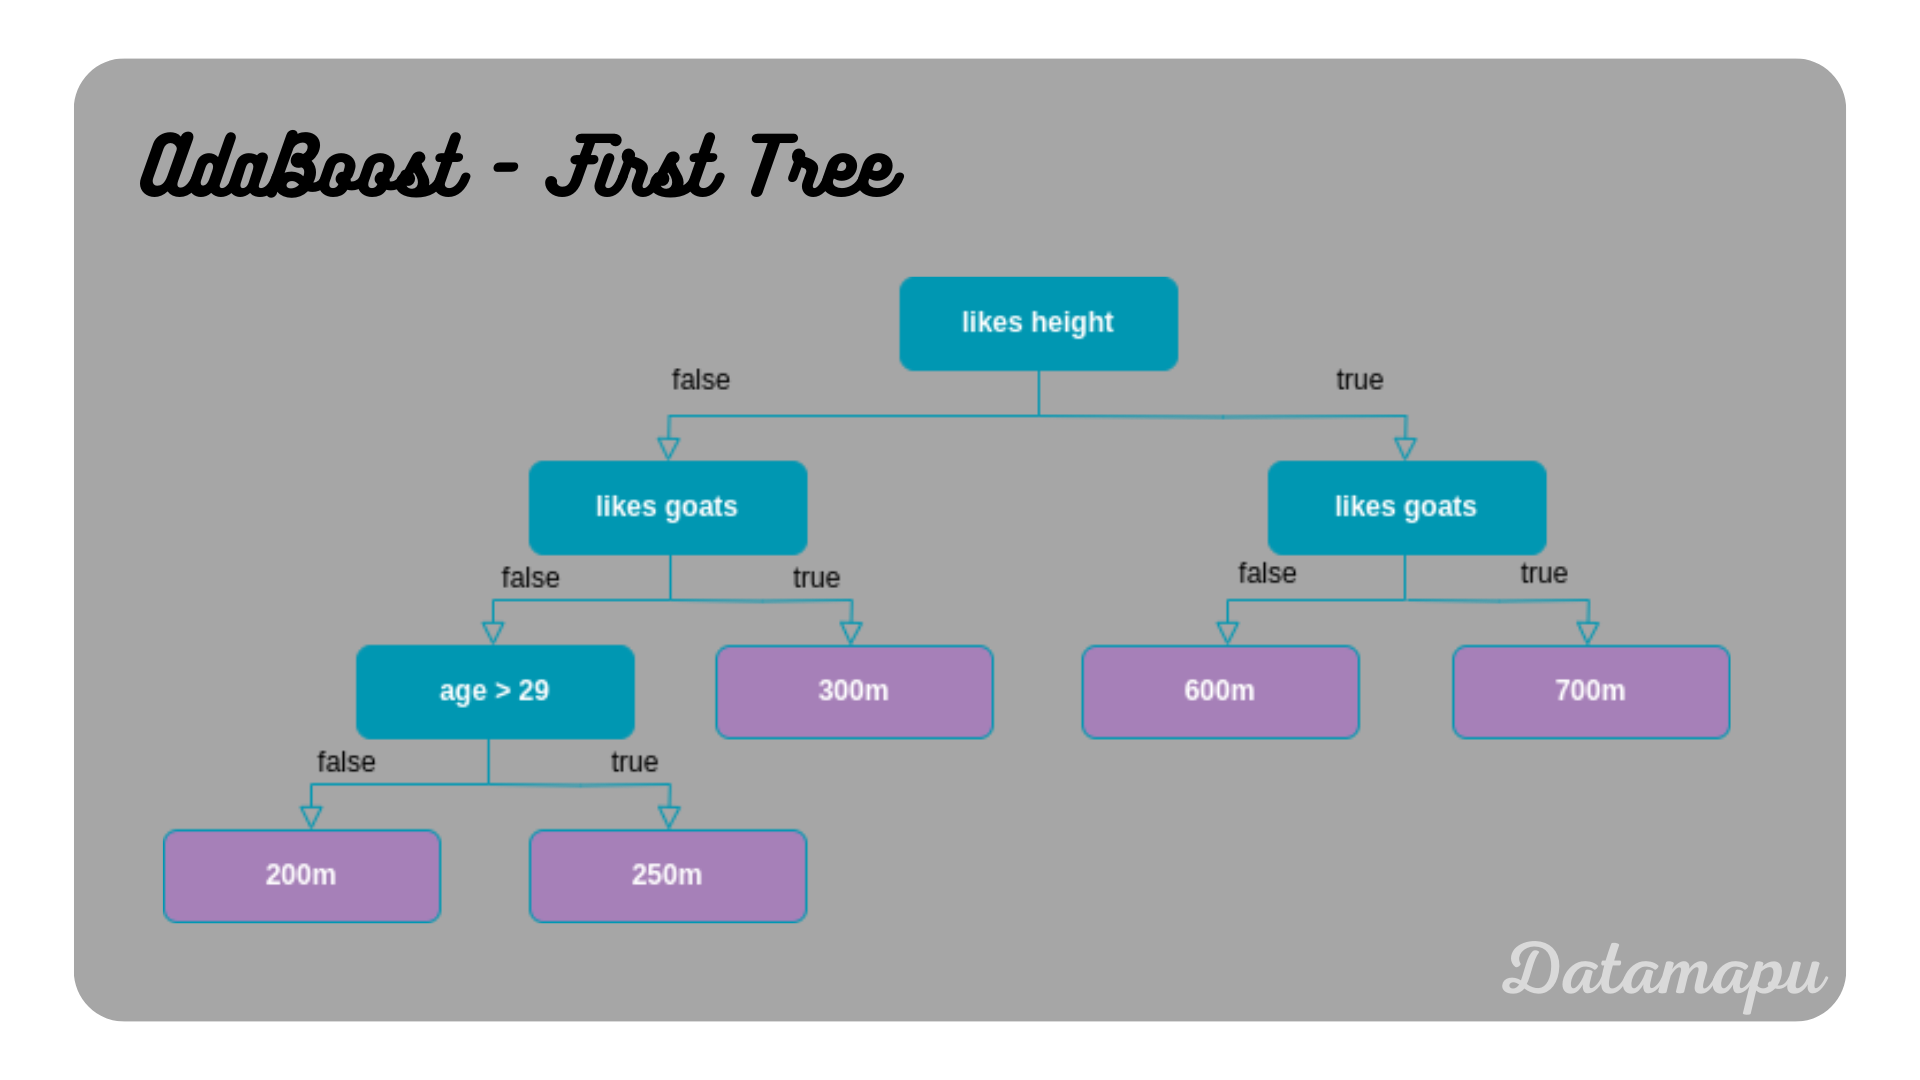 The first Decision Tree of the AdaBoost model.
Now, we determine the total error, which we define as the number of wrongly predicted samples divided by the total number of samples. Following the decision paths of the tree, we can find that the samples age$=35$, likes height$=0$, likes goats$=0$ and age$=42$, likes height$=0$, likes goats$=0$ lead to wrong predictions. The true target values are $300m$ and $200m$, respectivly, but the predicted value is $250m$ in both cases. The other eight samples are correctly predicted. The total error is thus $\frac{2}{10}$. The influence of this tree is therefore
$$\alpha = \frac{1}{2} \ln\Big(\frac{1 - TotalError}{TotalError}\Big)$$ $$\alpha = \frac{1}{2} \ln\Big(\frac{\frac{8}{10}}{\frac{2}{10}}\Big)$$ $$\alpha = \frac{1}{2} \ln(4) = 0.69.$$
Note, that different implementation of the AdaBoost algorithm for regression exist. Usually the prediction does not need to match exactly, but a margin is given, and the prediction is counted as an error if it falls out of this margin [1]. For the sake of simplicity, we will keep this definition analogue to a classification problem. The main idea of calculating the influence of each tree remains, but the way the error is exactly calculated may differ in different implementations.
With the influence $\alpha$, we can now calculate the new weights
$$w_{new} = w_{old}\cdot e^{\pm\alpha}.$$
The sign used in the exponent depends on whether the specific sample was correctly predicted or not. For correctly predicted samples, we get
$$w_{new} = 0.1\cdot e^{-0.69} = 0.05,$$
and for wrongly predicted samples
$$w_{new} = 0.1\cdot e^{0.69} = 0.2.$$
These weights need to be normalized, which is done by dividing by their sum.
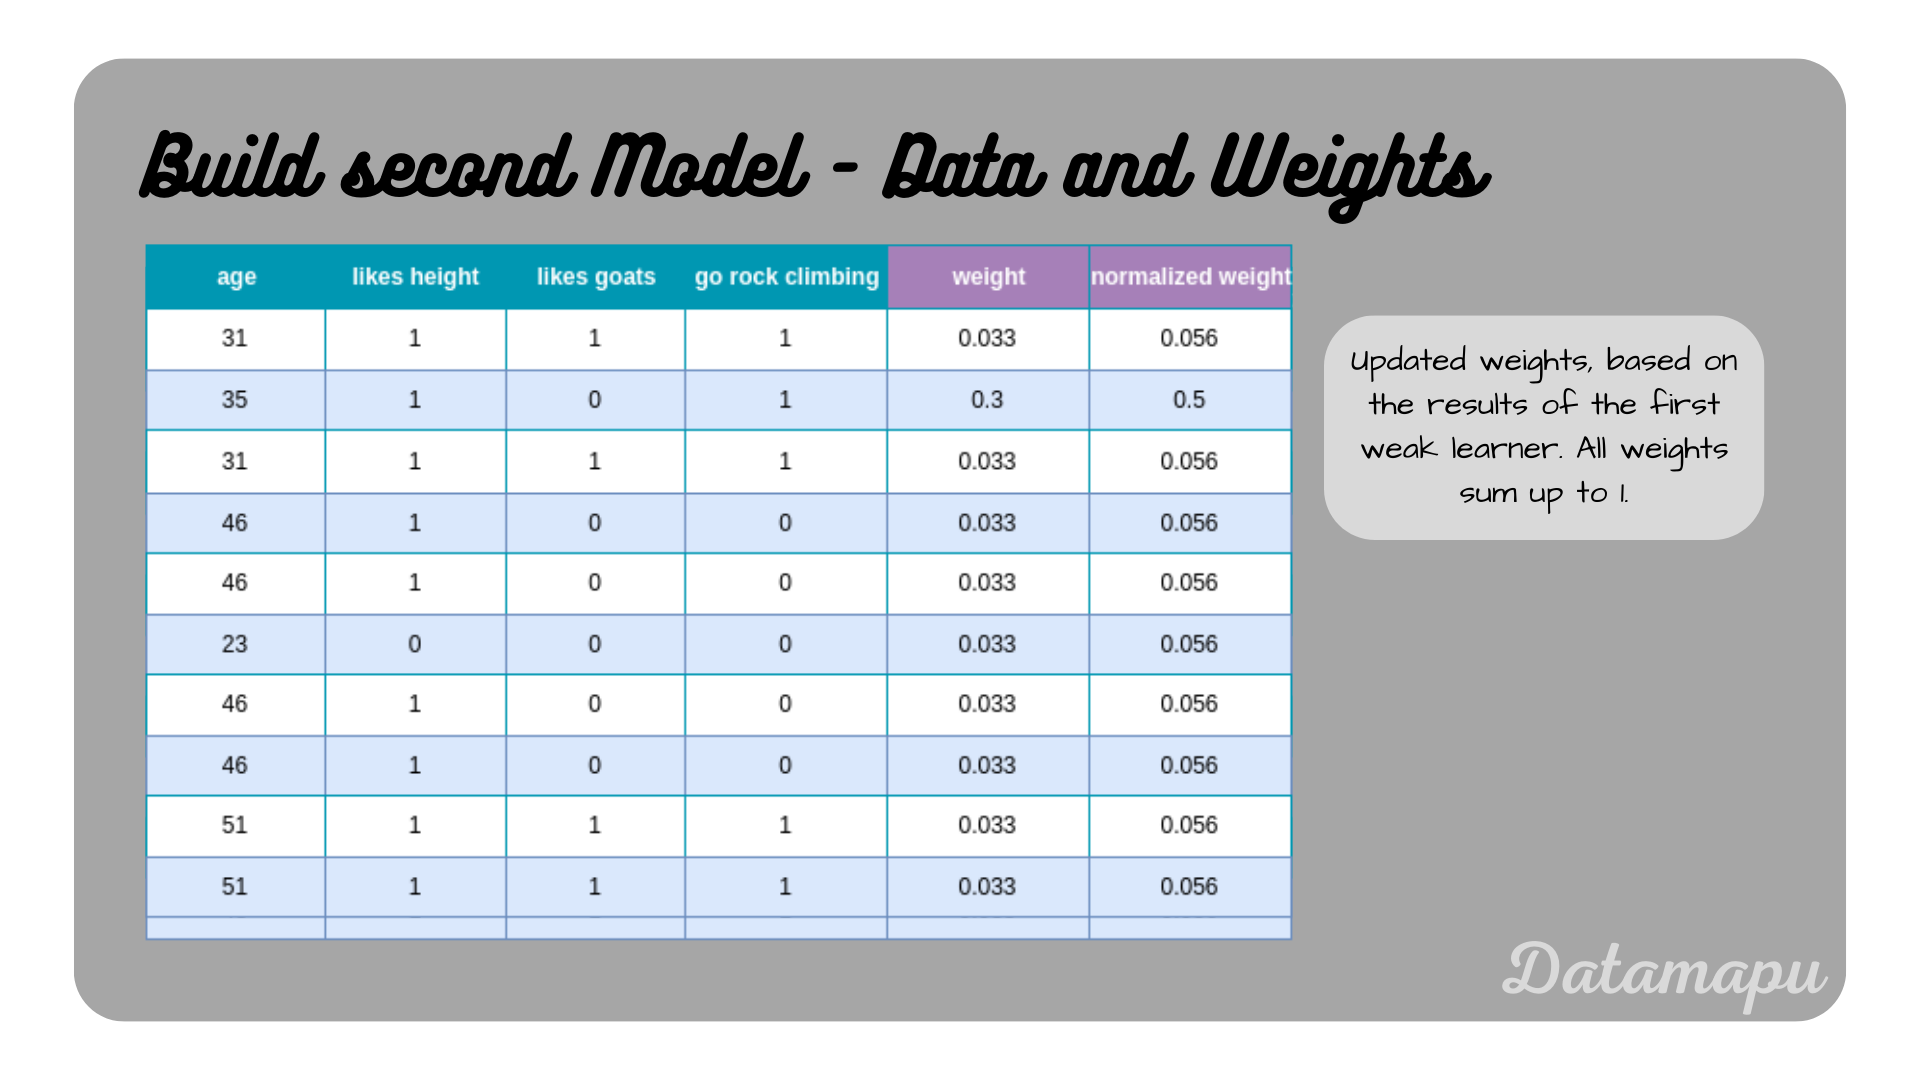 The dataset with the updated weights asigned to each sample.
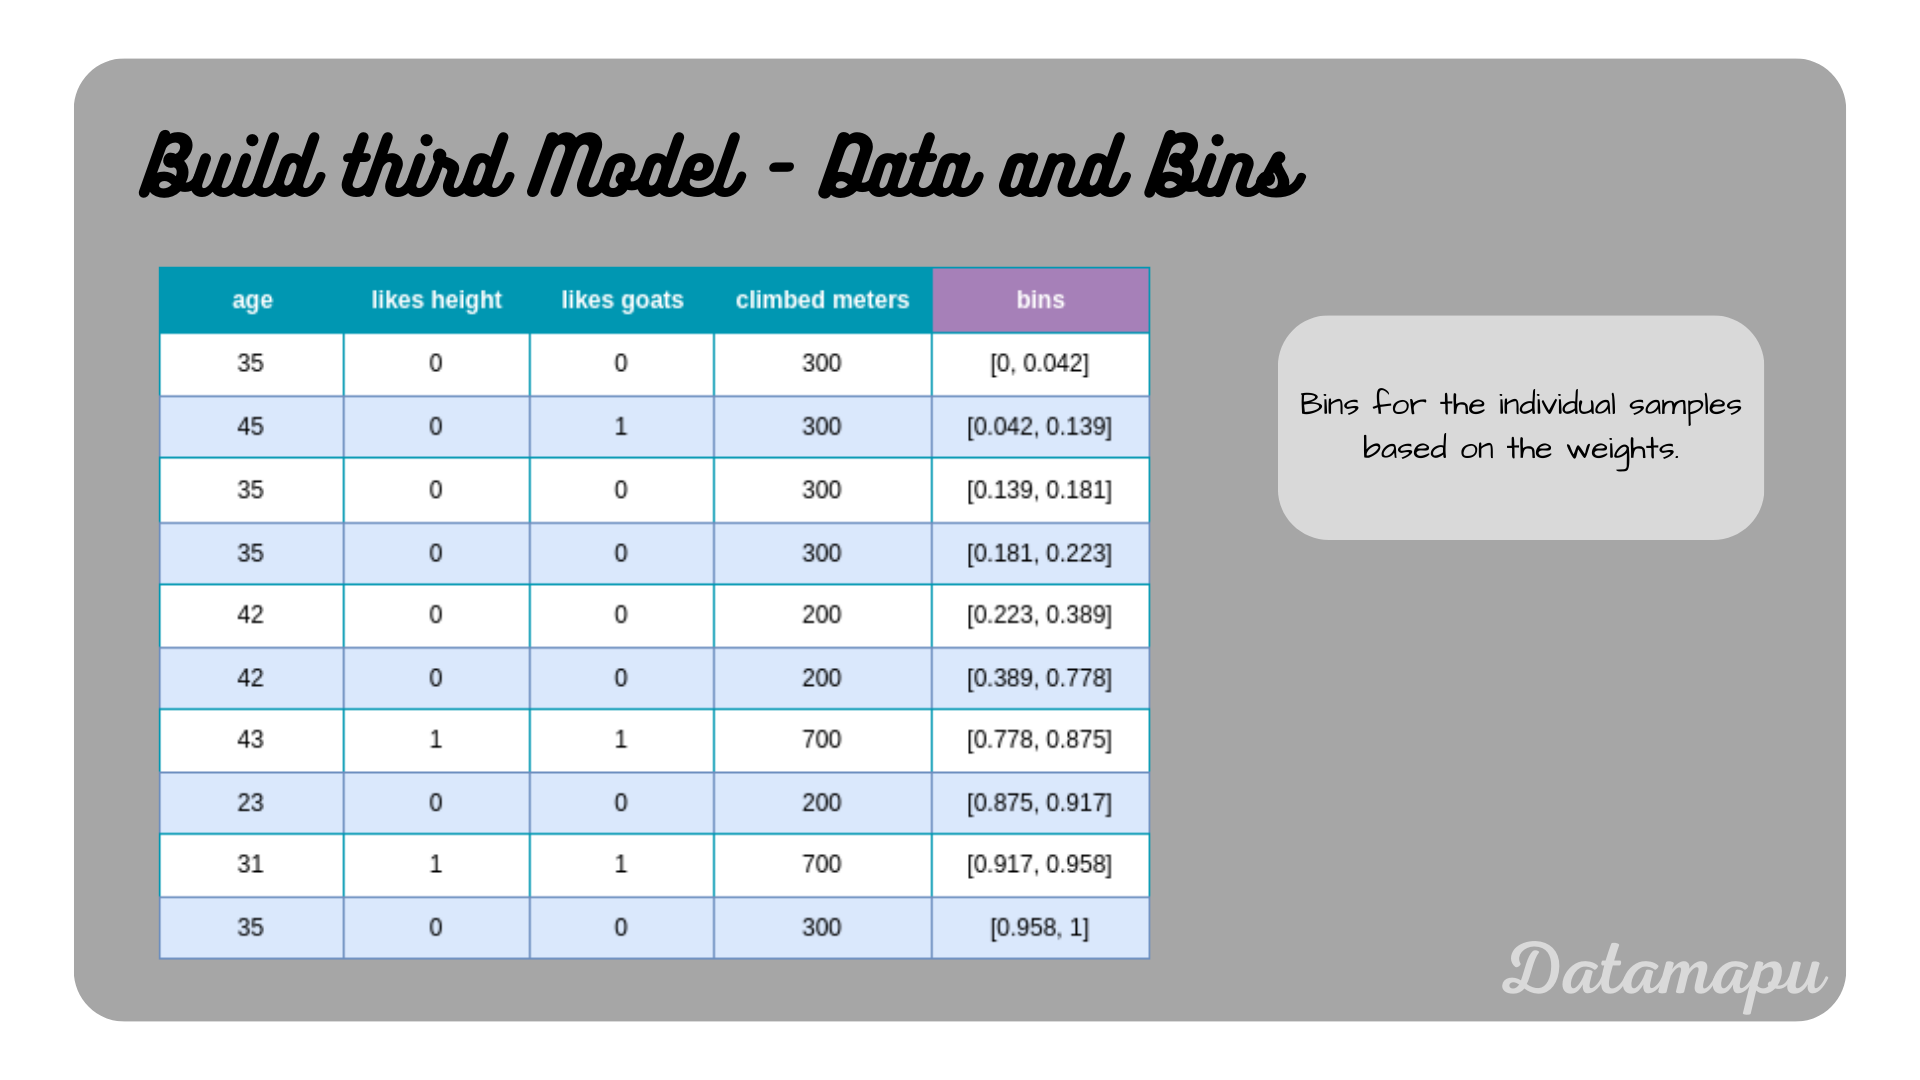
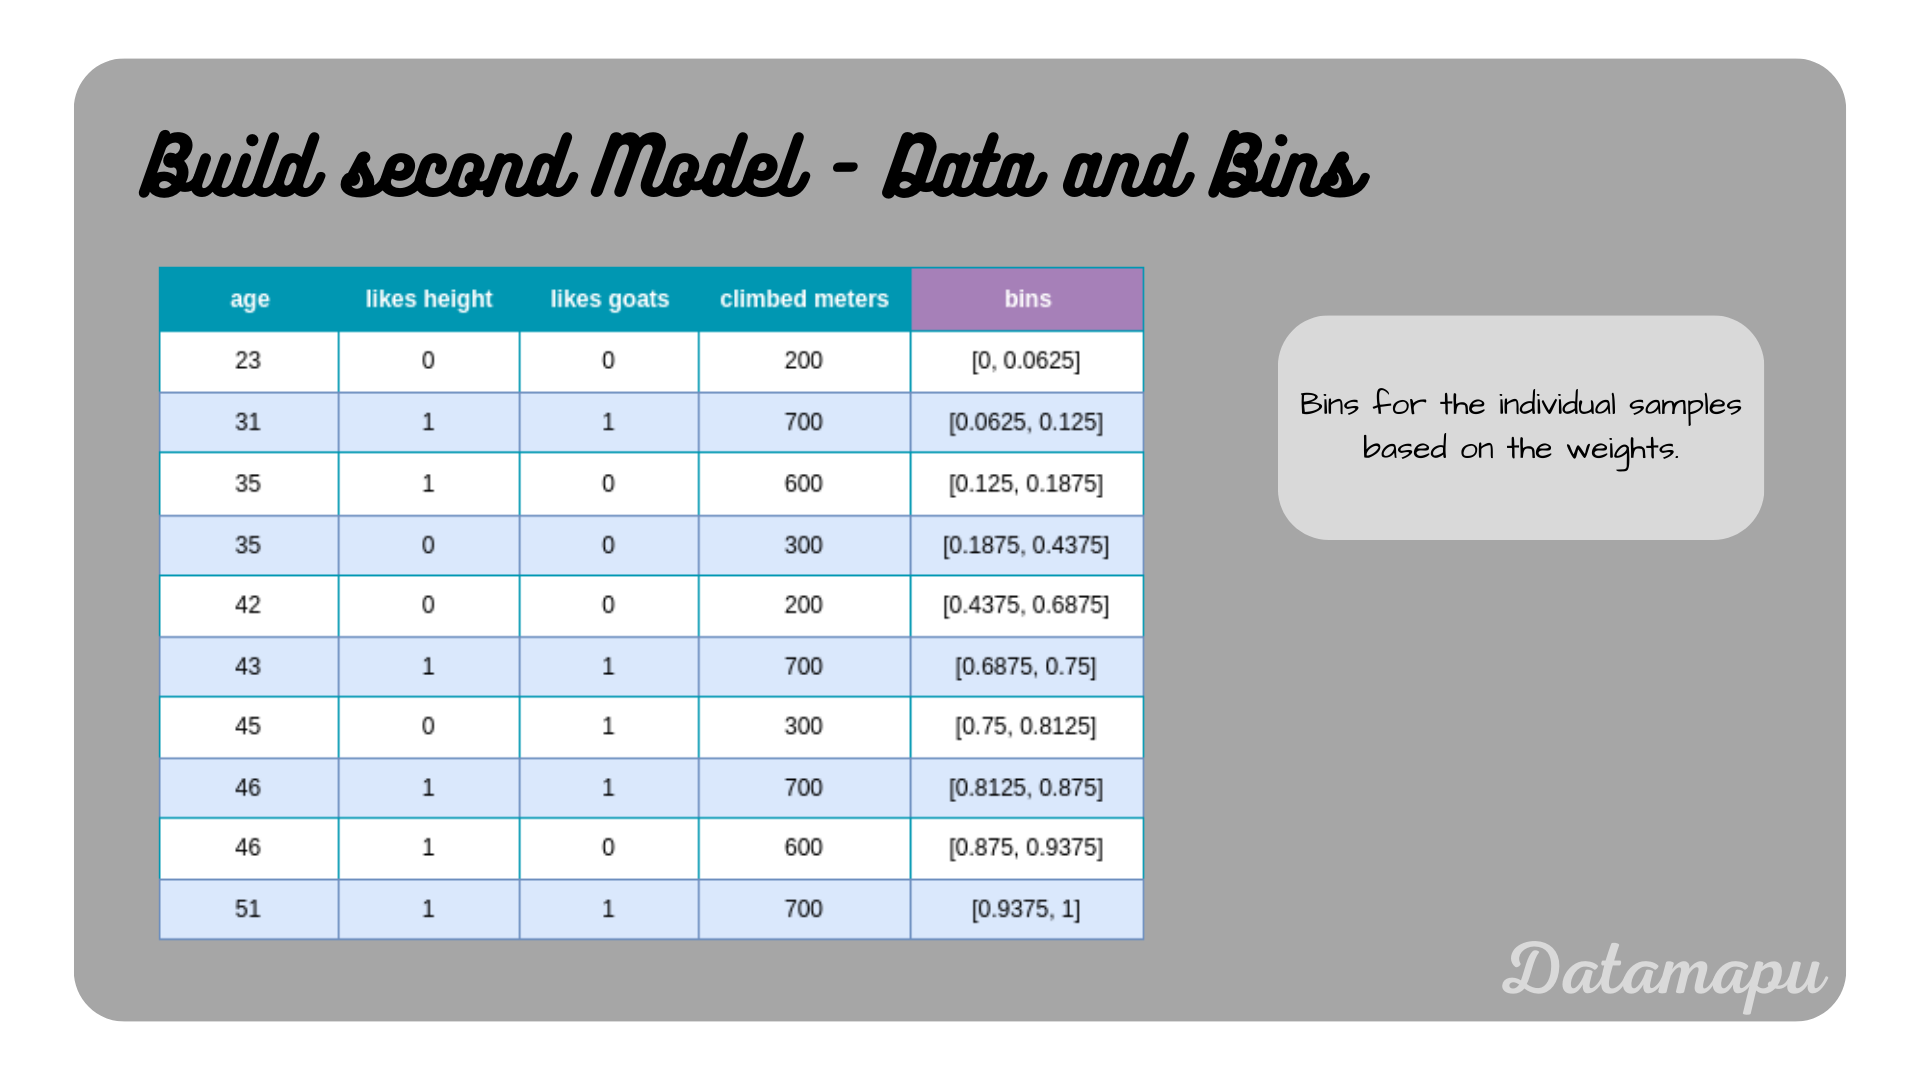 The dataset with the bins based on the weights for each sample.
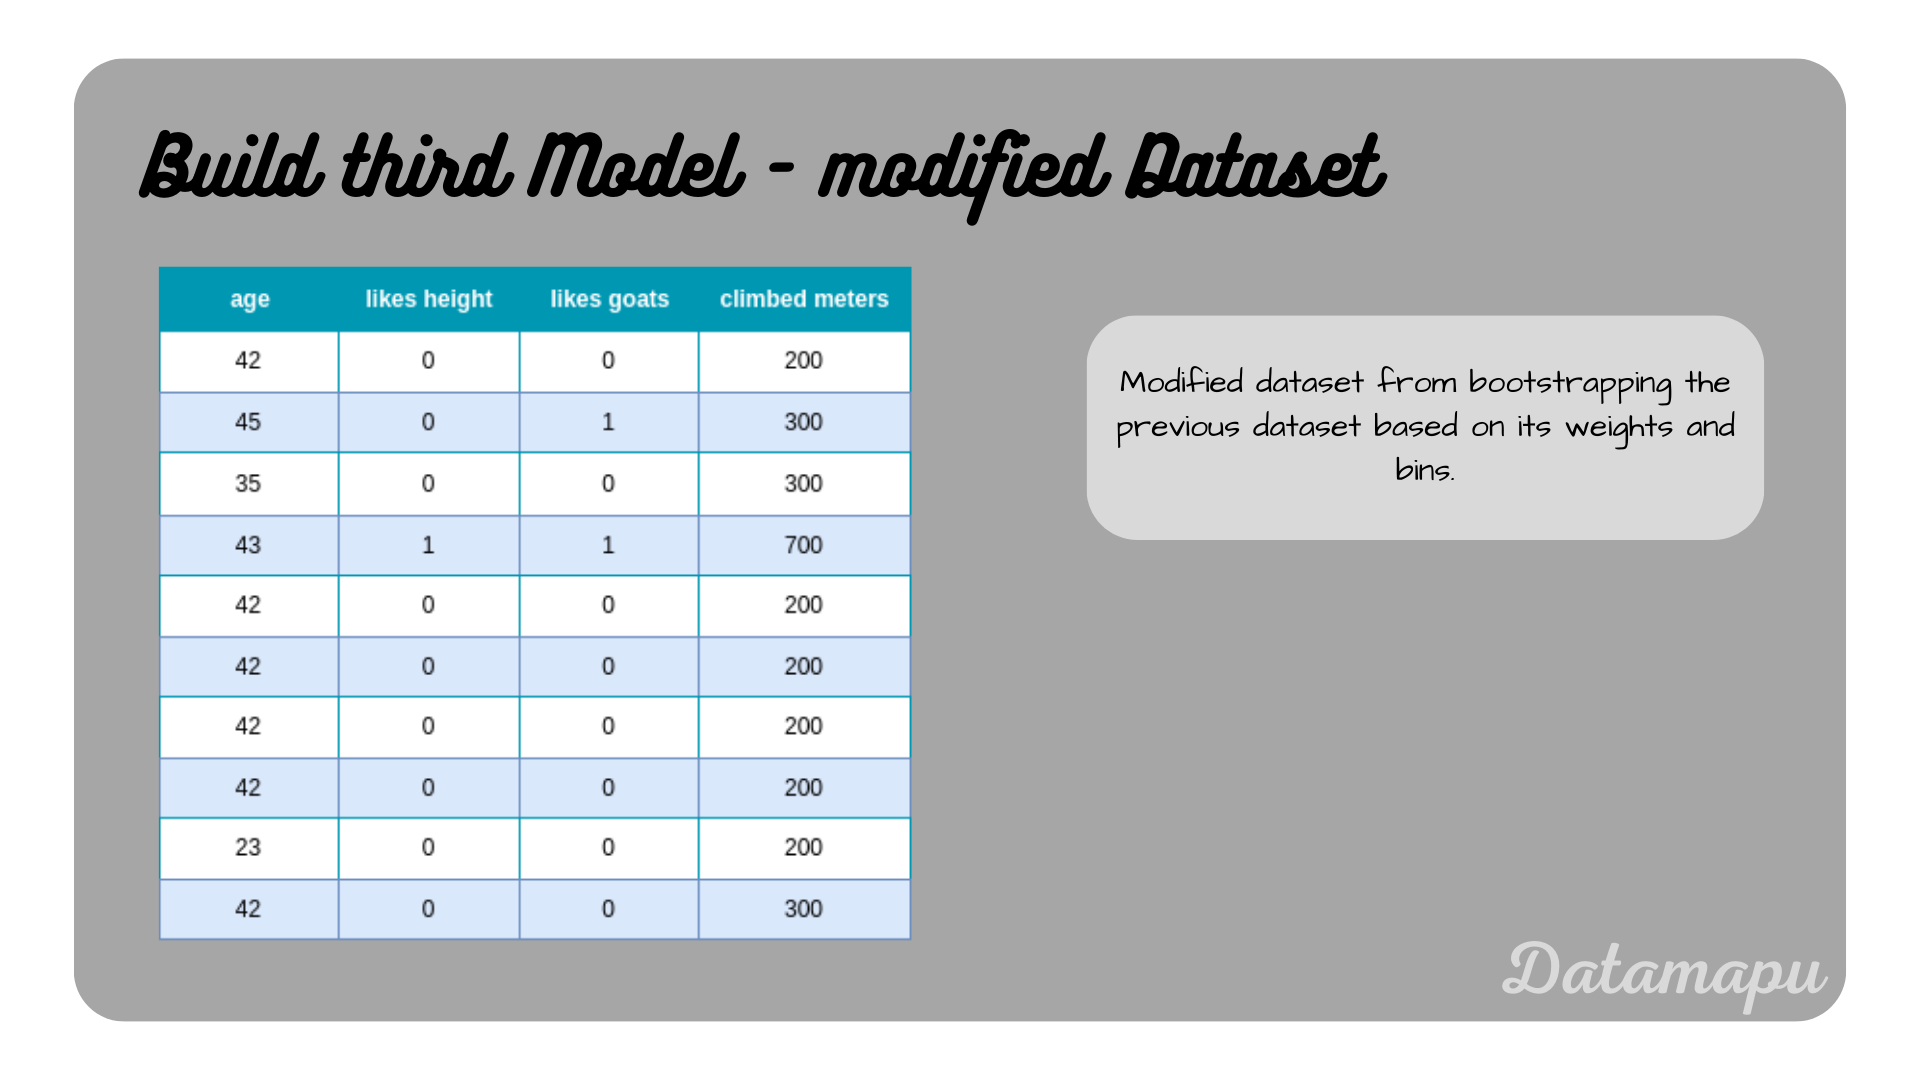
Now bootstrapping is performed to create a modified dataset, which we can use to build the next model. For that, we simulate drawing random numbers between $0$ and $1$ to decide the indices taken for the modified dataset. Note, that the bins of the two wrongly predicted samples are larger due to their higher weights. The probability of getting a number in the bin of the wrongly predicted samples is thus higher and these samples will likely be higher represented in the new dataset. Let’s assume, the random numbers drawn are $[0.2, 0.8, 0.4, 0.3, 0.6, 0.5, 0.05, 0.1, 0.25]$, which refer to the samples $[3, 6, 3, 3, 4, 4, 5, 0, 1, 3]$. The modified dataset is shown in the next plot.
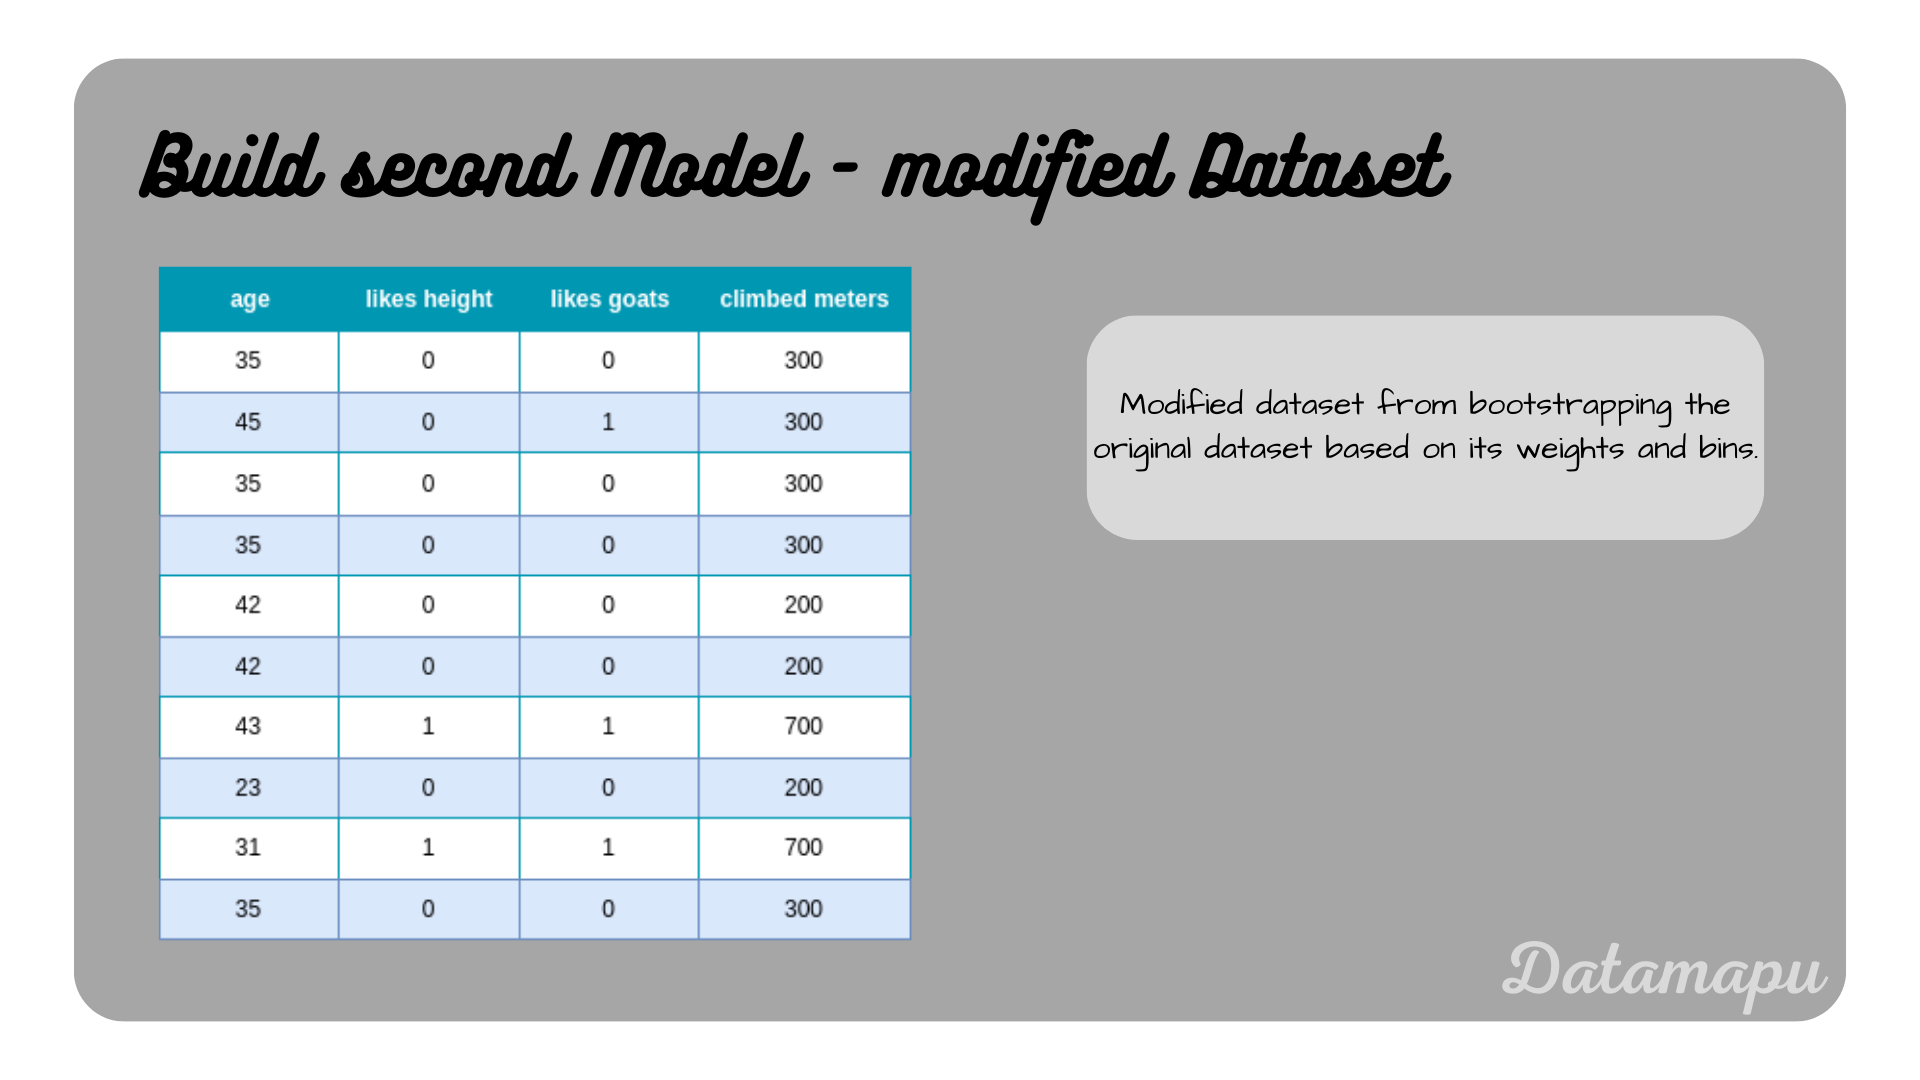 Modified dataset based on the weights.
Now, we fit the second model to this modified dataset. The resulting model is illustrated in the next plot.
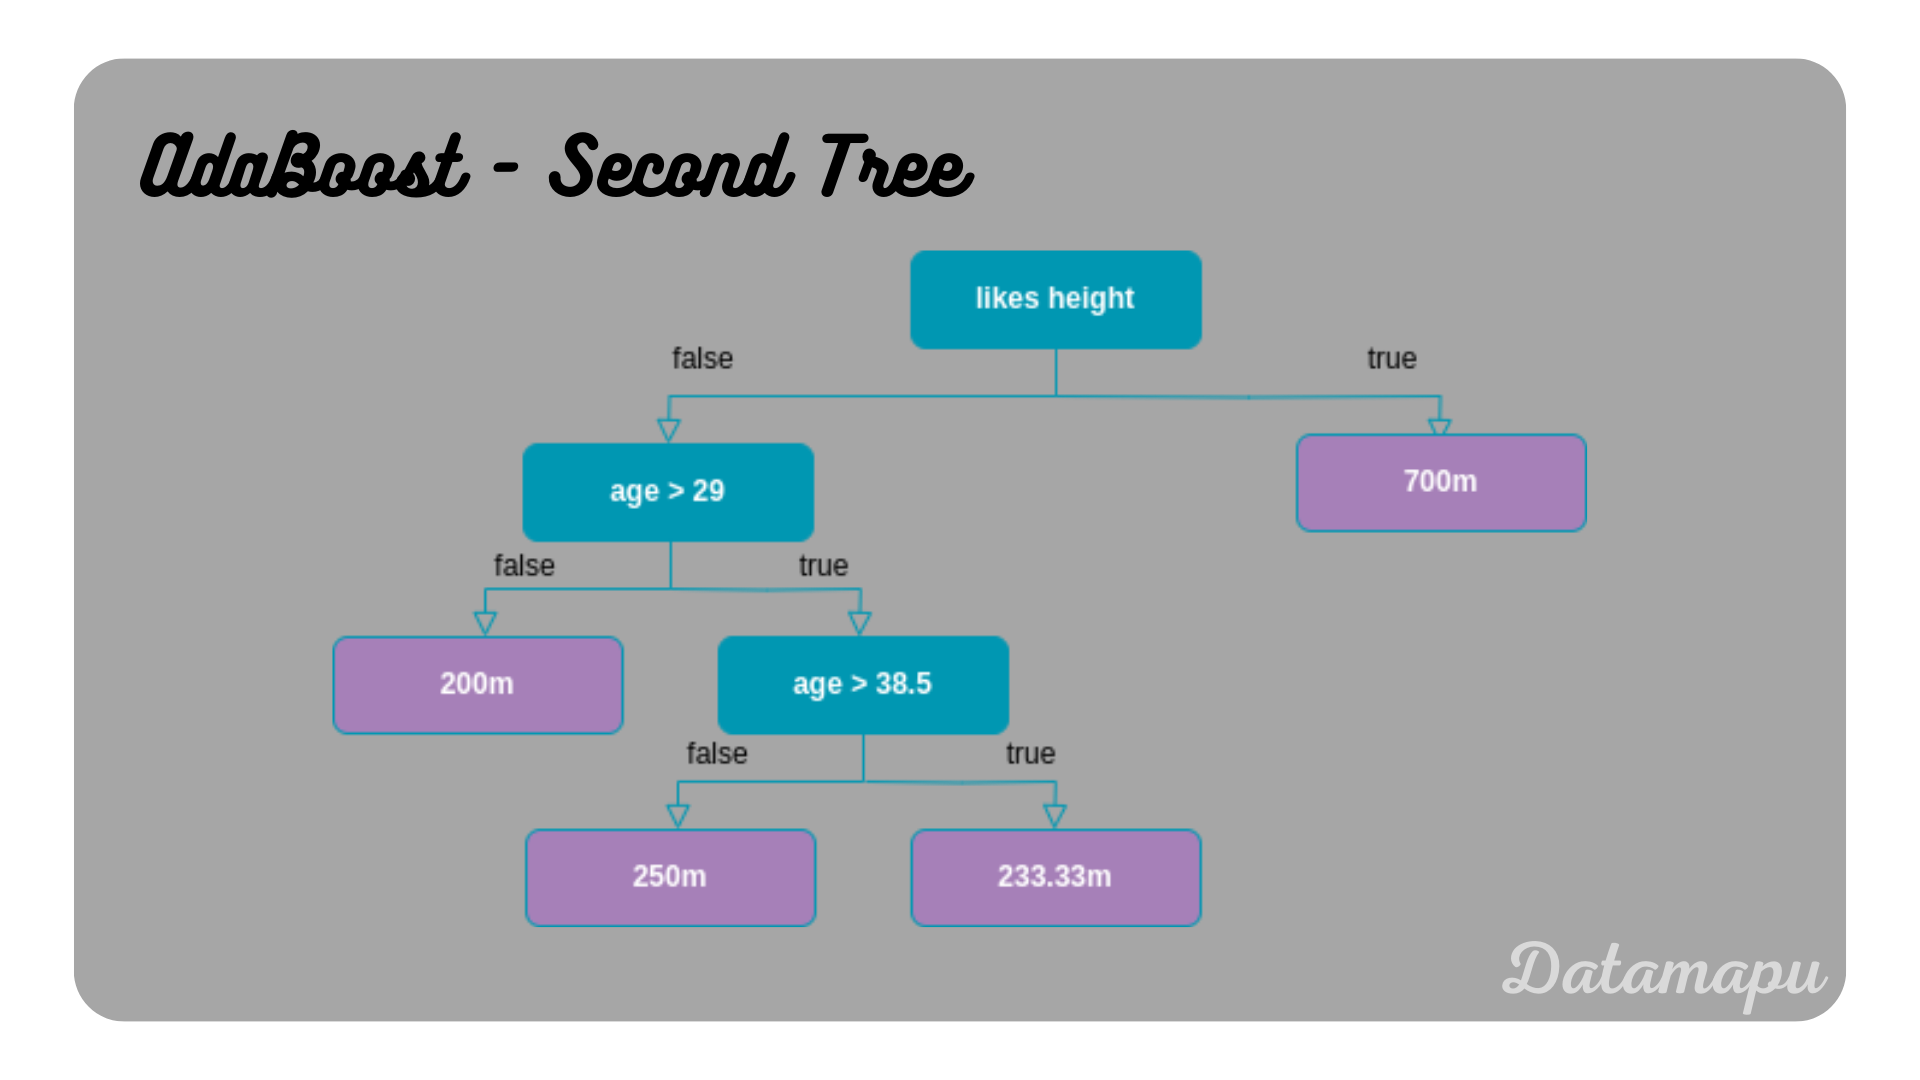 The second Decision Tree of the AdaBoost model.
Following the decision paths of this tree we see that three samples are wrongly predicted. The sample age $= 45$, likes height $= 0$, and likes goats $=0$ yields $233.33m$, but the true value is $300m$. The sample age $= 42$, likes height $= 0$, and likes goats $= 0$, which is twice in the dataset also results in a prediction of $233.33m$, but the true value is $200m$. The remaining samples are correctly predicted. The Total Error is thus $\frac{3}{10}$. The influence $\alpha$ is therefore
$$\alpha = \frac{1}{2} \ln\Big(\frac{1 - TotalError}{TotalError}\Big)$$ $$\alpha = \frac{1}{2} \ln\Big(\frac{\frac{7}{10}}{\frac{3}{10}}\Big)$$ $$\alpha = \frac{1}{2} \ln(\frac{7}{3}) = 0.42.$$
The weights are then updated following the above formula. The old weights can be looked up in the previous table. For the first sample, which was correctly predicted, we get $$w_{new} = w_{old} \cdot e^{-\alpha},$$ $$w_{new} = 0.0625 \cdot e^{-0.42},$$ $$w_{new} = 0.041.$$
The second sample was wrongly predicted, thus the sign in the exponent is positive. The new weight calculates as
$$w_{new} = w_{old} \cdot e^{\alpha},$$ $$w_{new} = 0.0625 \cdot e^{0.42},$$ $$w_{new} = 0.095.$$
The new weights again need to normalized. The weights for all samples are summarized in the following plot.
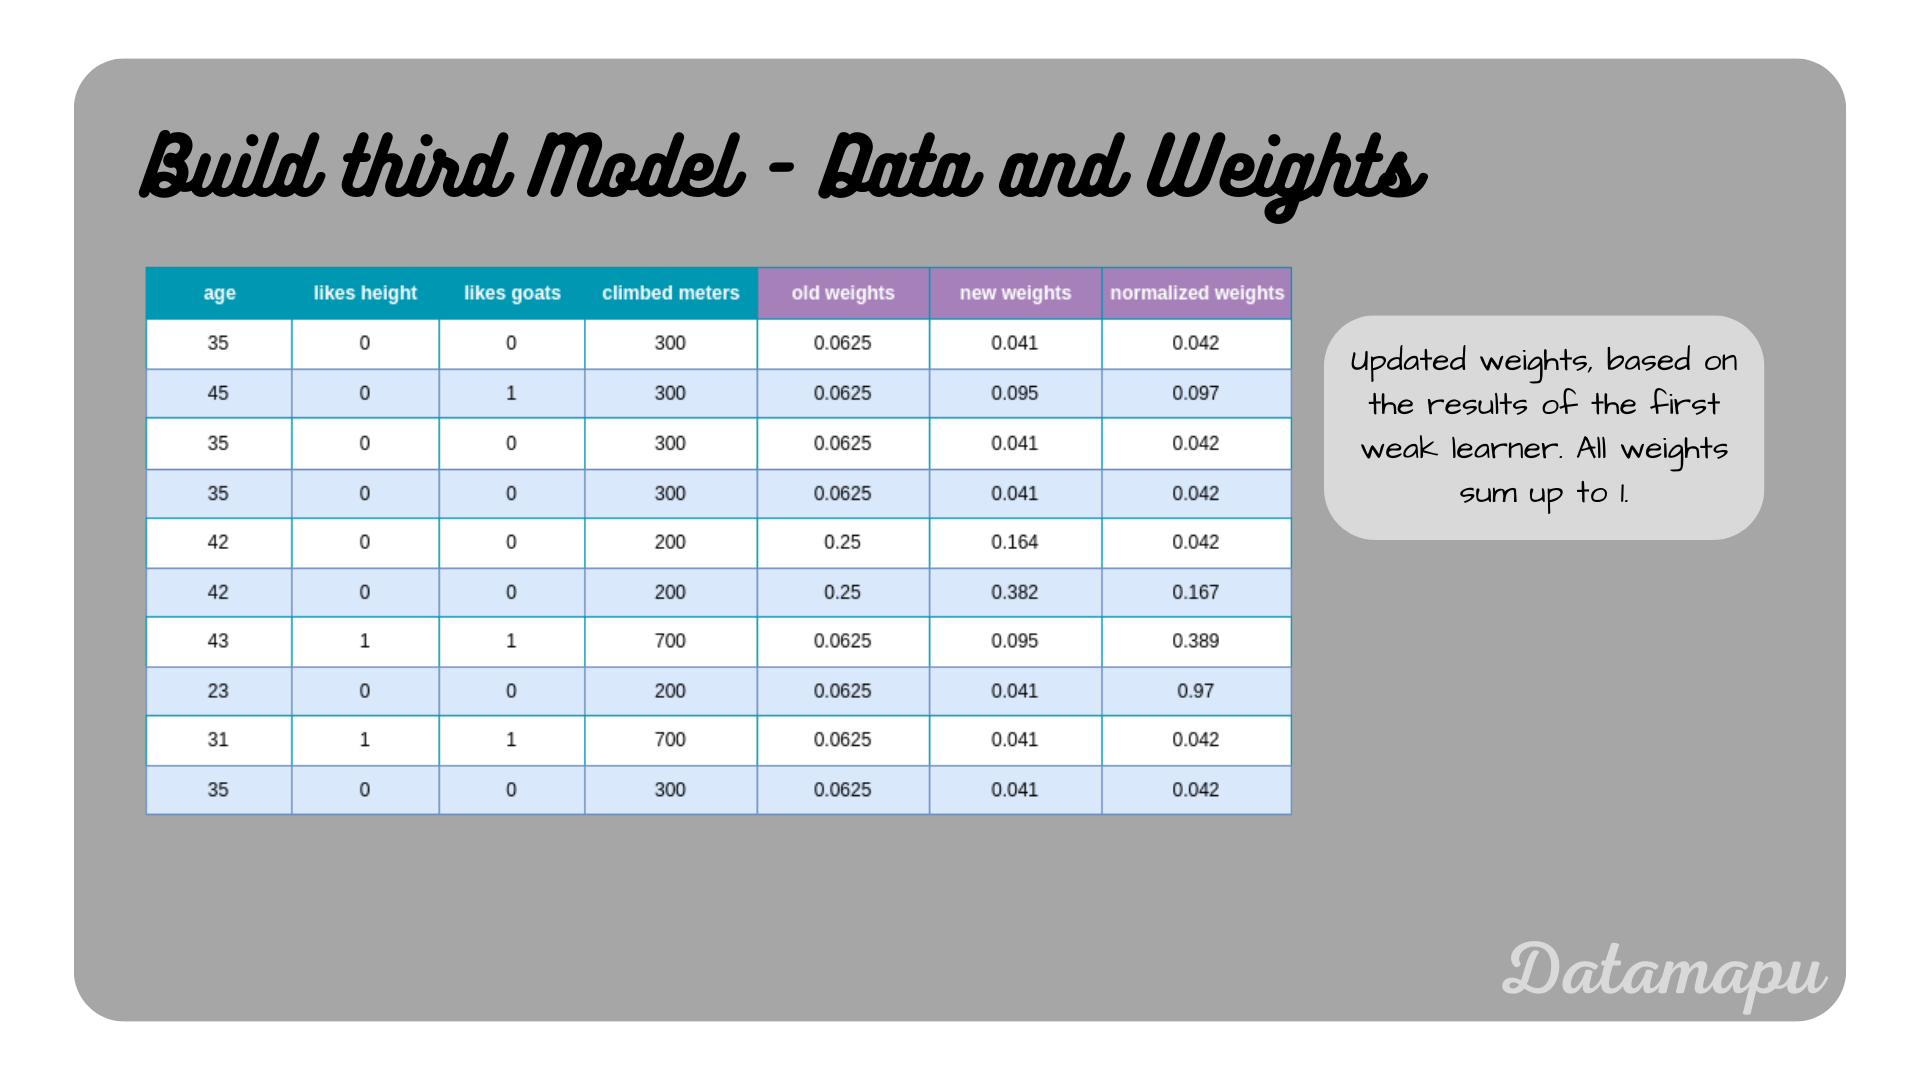 The dataset with the updated weights asigned to each sample.
From the normalized weights, we calculate the bins.
 The dataset with the asigned bins to each sample.
Again, we simulate drawing 10 random numbers. Let’s assume, we got the random numbers $[0.8, 0.92, 0.1, 0.4, 0.6, 0.3, 0.5, 0.2, 0.35, 0.97, 0.7]$, which refer then to the samples $[6, 8, 1, 5, 5, 4, 5, 4, 9, 5]$. The modified dataset based on the bins is shown in the following plot.
 Modified dataset based on the weights.
Form this dataset we build the third and last model, which is shown in the following plot.
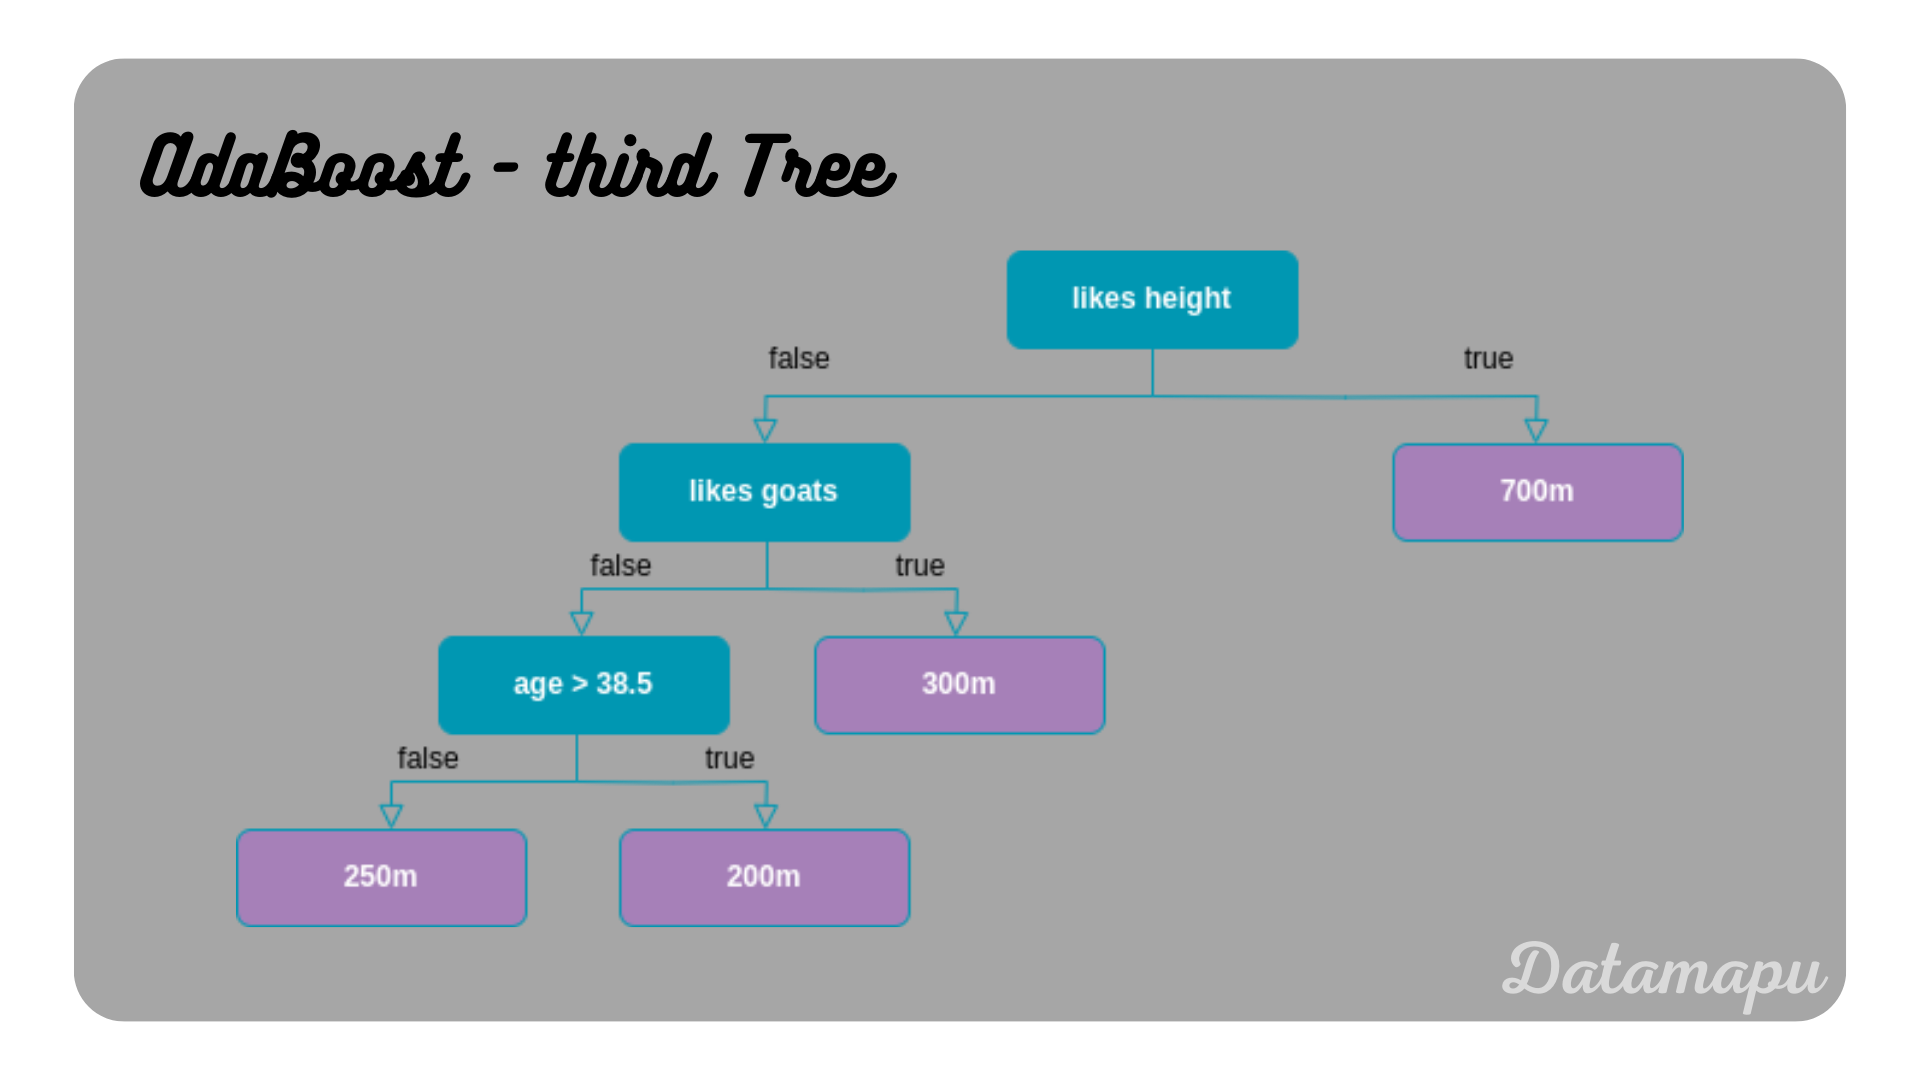 The third Decision Tree of the AdaBoost model.
The only thing missing now to make the final prediction is the influence $\alpha$ of this last tree. The third tree predicts one sample wrongly, which is age $= 35$, likes height $=0$, and likes goats $= 0$ leads to a prediction of $250m$, while the correct value is $300m$. The total error is thus $\frac{1}{10}$ and therefore
$$\alpha = \frac{1}{2} \ln\Big(\frac{1 - TotalError}{TotalError}\Big)$$ $$\alpha = \frac{1}{2} \ln\Big(\frac{\frac{9}{10}}{\frac{1}{10}}\Big)$$ $$\alpha = \frac{1}{2} \ln(9) = 1.099.$$
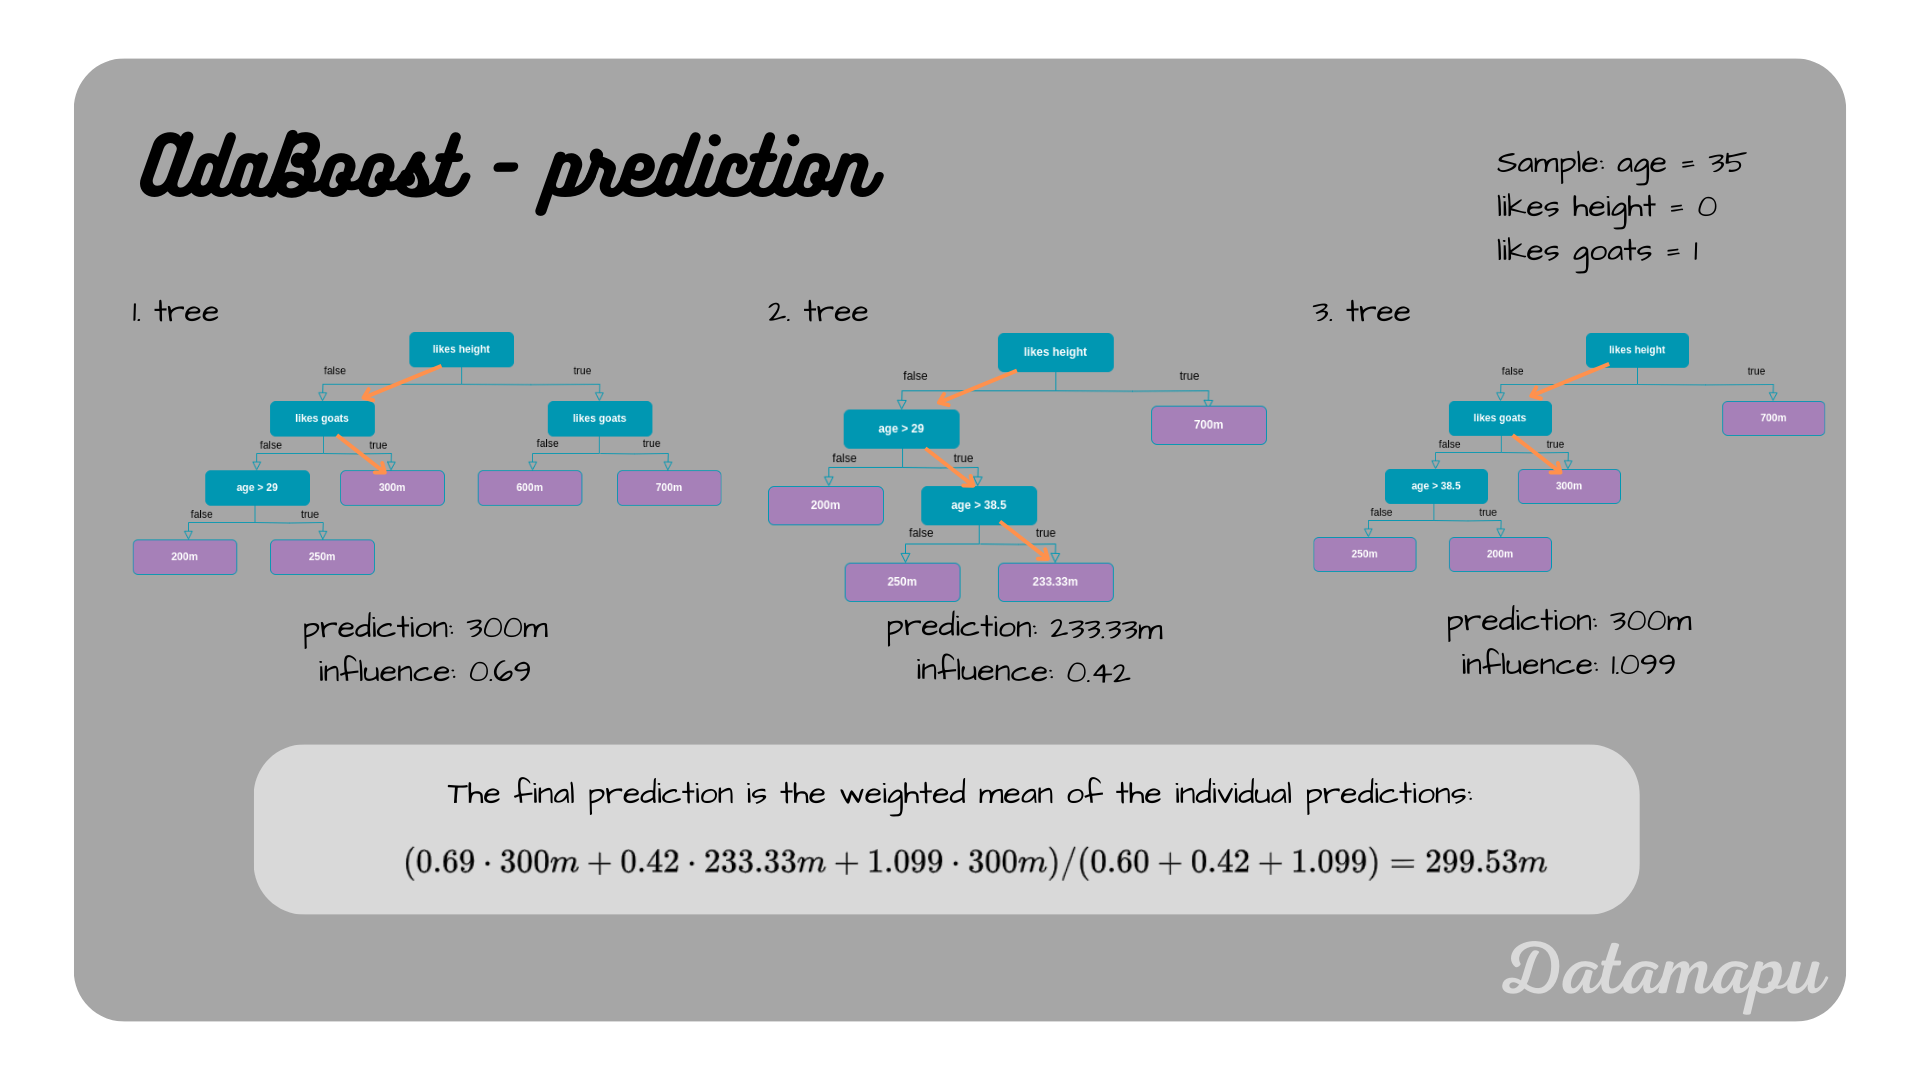
Let’s now use the model to make a prediction. Consider the following sample.
| Feature | Value |
|---|---|
| age | 45 |
| likes height | 0 |
| likes goats | 1 |
To make the final prediction, we need to consider all the individual predictions of all the models. The weighted mean of these predictions is then the prediction of the constructed esemble AdaBoost model. As weights the values for the influence is used. Following the decision path of the first tree, results in a prediction of $300m$, the second tree predicts $233.33m$ and the third tree again predicts $300m$. The final prediction is than calculated as
$$\hat{y} = \frac{0.69\cdot300 m+ 0.42\cdot233.33m + 1.099\cdot300m}{0.60 + 0.42 + 1.099} = 299.53m.$$
The true value of this sample is $300m$.
 The final prediction for a specific sample.
Fit a Model in Python
After developing a model by hand, we will now see how to fit a AdaBoost for a regression task in Python. We can use the sklearn method AdaBoostRegressor. Note: The fitted model in sklearn differs from our developed model, due to some randomness in the algorithm and due to differences in the implementation of the algorithm. Randomness occurs in the underlying DecisionTreeRegressor algorithm and in the boosting used in the AdaBoostRegressor. The main concepts, however, remain the same.
We first create a dataframe for our data.
| |
Now, we can fit the model. Because this example is only for illustration purposes and the dataset is very small, we limit the number of underlying Decision Trees to three, by setting the hyperparameter n_estimators=3. Note, that in a real world project, this number would usually be much higher, the default value in sklearn is $100$.
| |
We can then make predictions using the predict method and print the score, which is defined as the mean accuracy.
| |
This leads to the predictions $[250, 700, 600, 300, 200, 700, 300, 700, 700, 700]$ and a score of $0.97$. Additionally, we can also print the predictions of the individual models for the three stages using the method staged_predict.
| |
This yields to
stage 1: $[250, 700, 700, 250, 200, 700, 300, 700, 700, 700]$,
stage 2: $[300, 700, 600, 300, 200, 700, 300, 700, 600, 700]$, and
stage 3: $[250, 700, 600, 300, 200, 700, 300, 700, 700, 700]$
which shows that all three models yield to different predictions for some samples. The influences are called estimator_weights_ in sklearn and can also be printed.
| |
For this example the weights are $[1.38629436, 1.14072377, 1.26274917]$. These weights are used for the final prediction, which is achieved by calculating the weighted mean of the individual predictions, with the weights being the influences of the underlying models. Let’s consider a concrete example and make predictions for one sample of the dataset.
| Feature | Value |
|---|---|
| age | 45 |
| likes height | 0 |
| likes goats | 1 |
We can visualize the underlying Decision Trees and follow the decision paths. For the first tree the visualization is achieved as follows.
| |
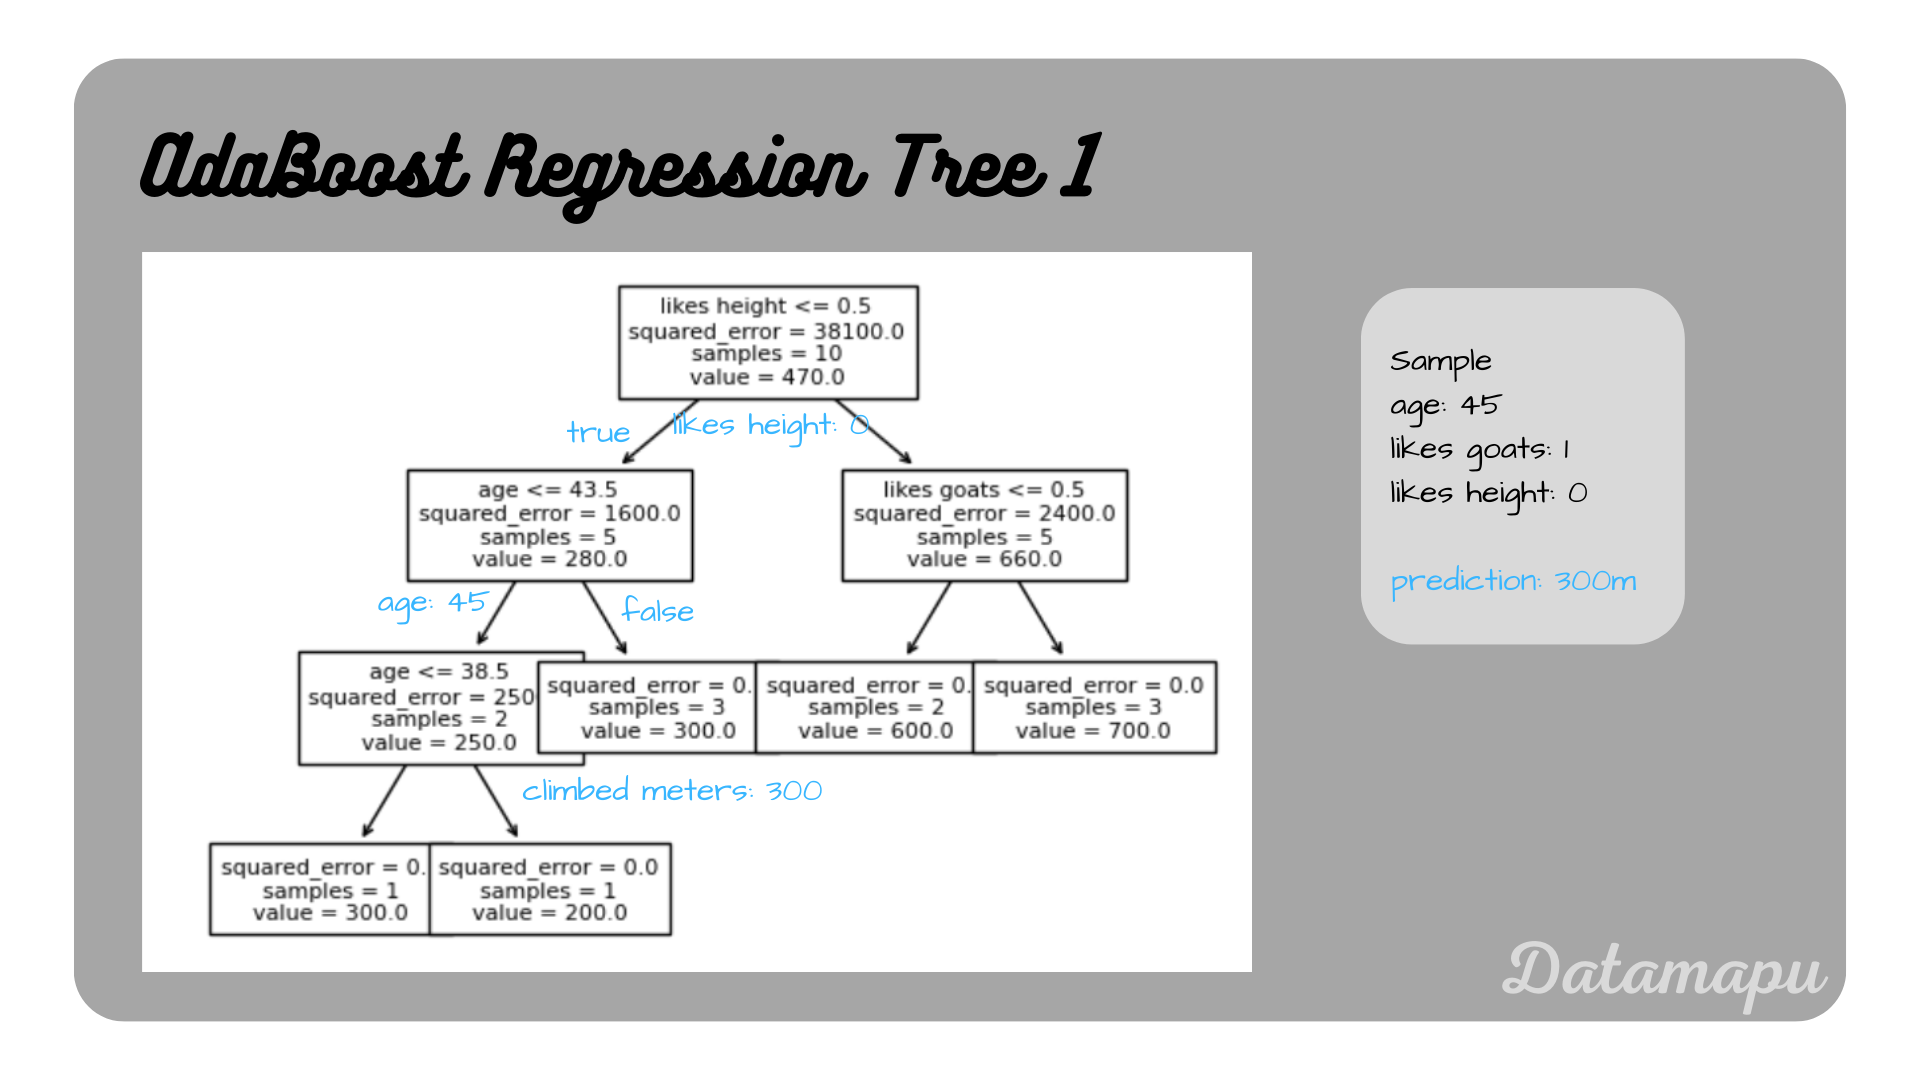 Prediction of the first tree.
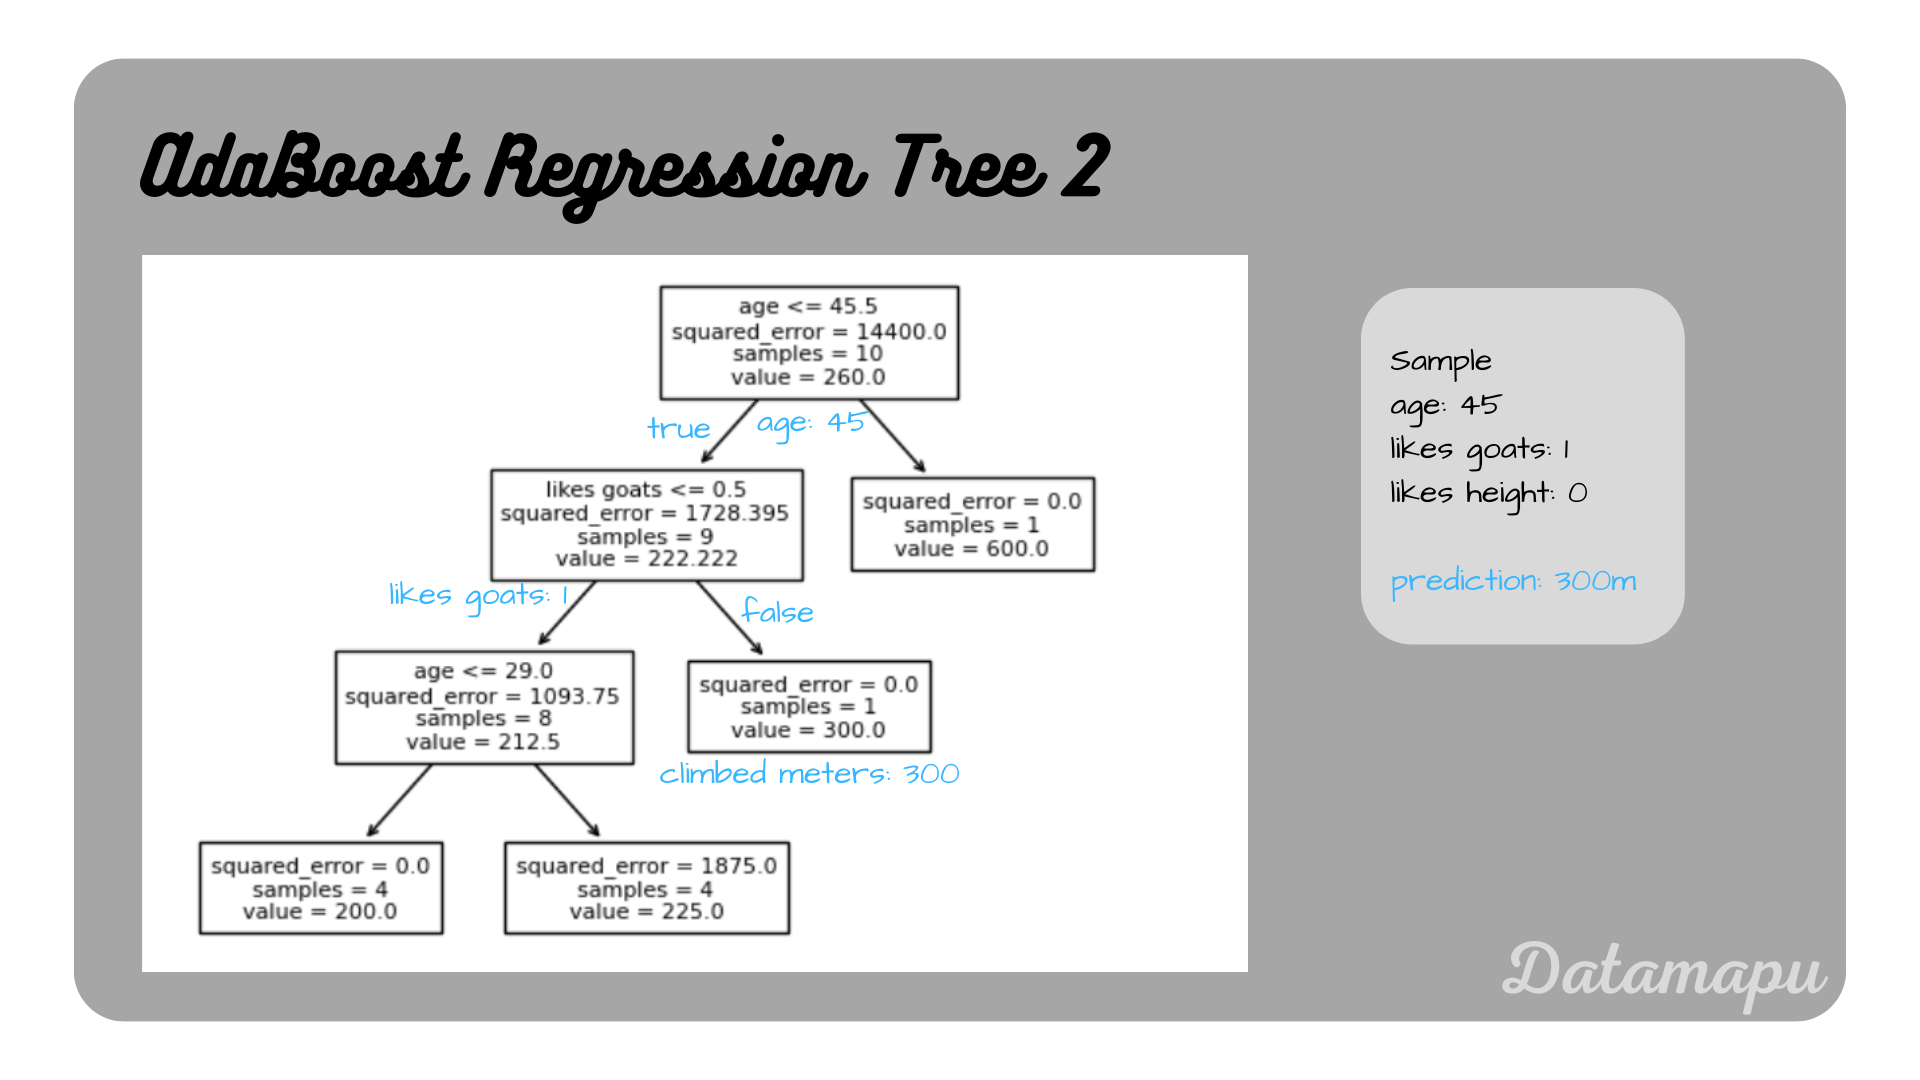 Prediction of the second tree.
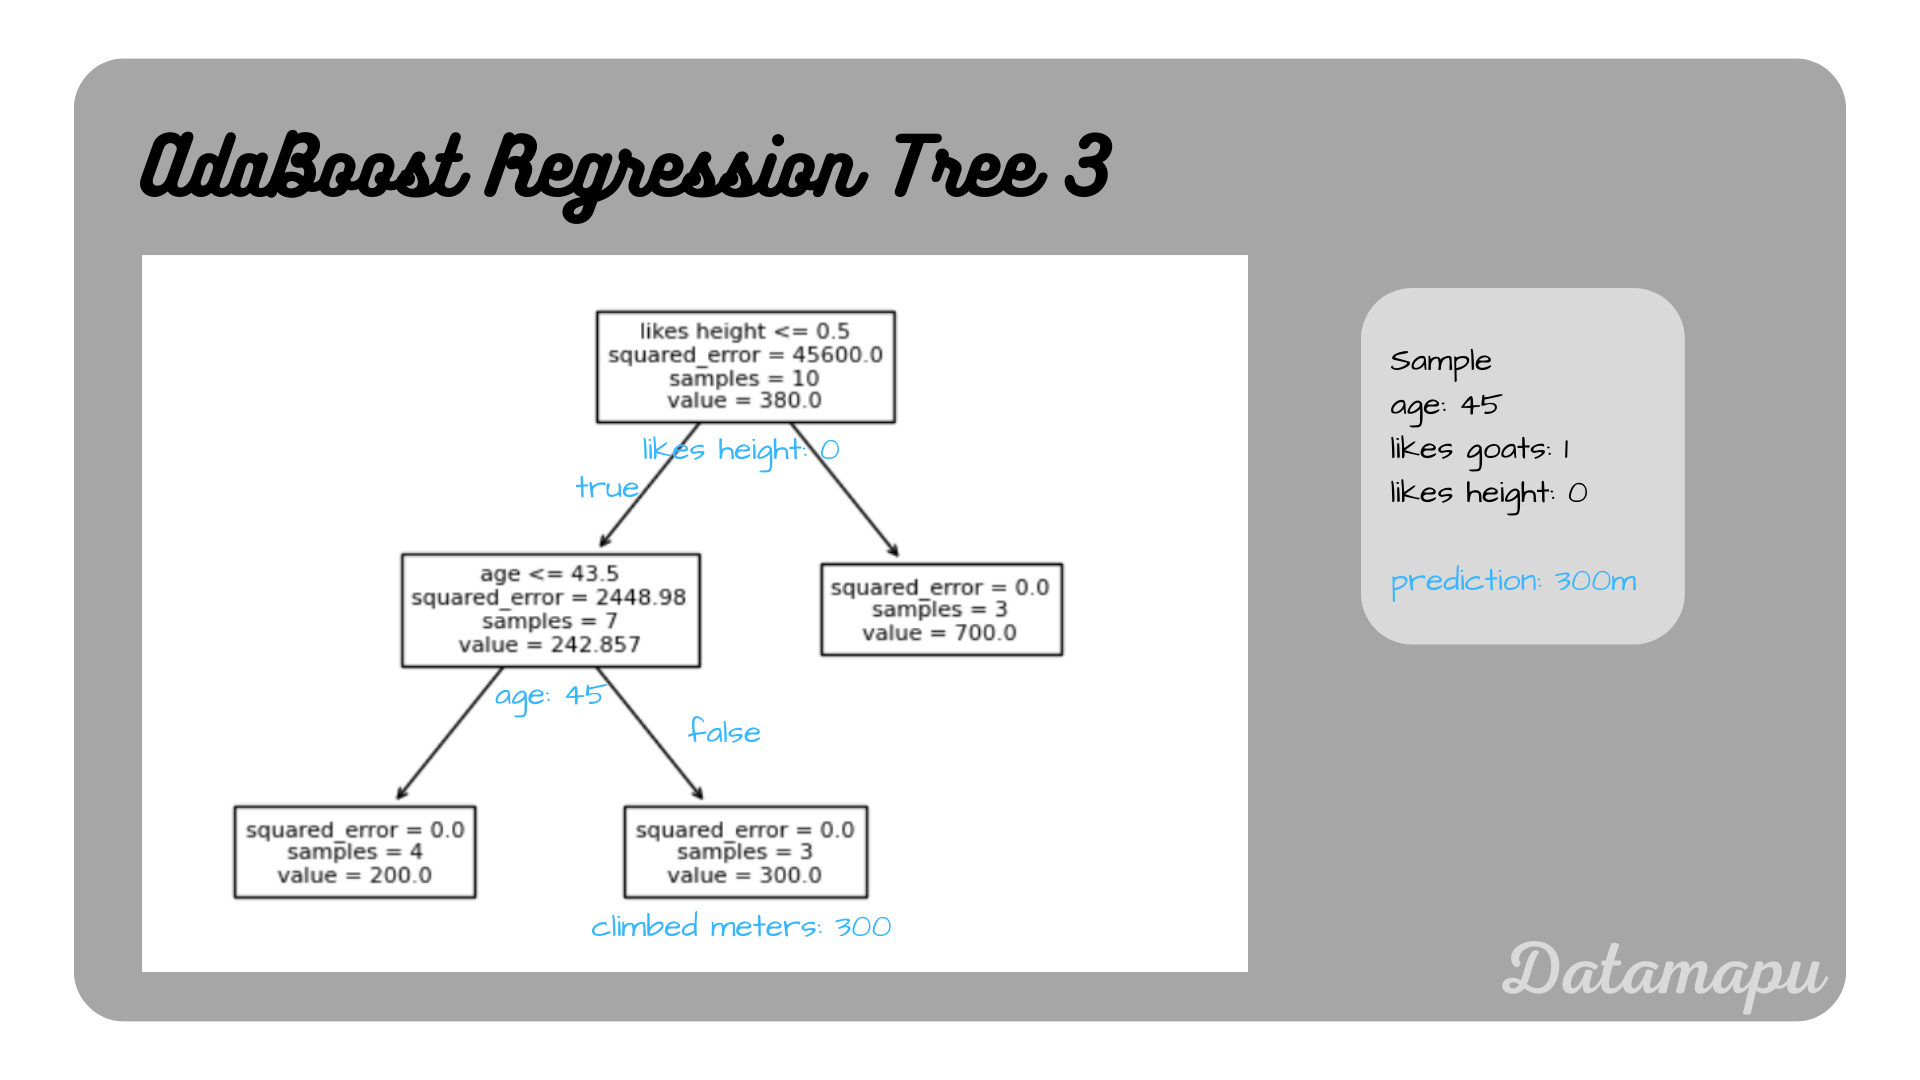 Prediction of the third tree.
Combining these three predictions with the influences (estimator_weights_) leads to the final prediction
$$\hat{y} = \frac{\sum w_i \cdot \hat{y}_i}{\sum w_i}$$
Filling in the according numbers, this gives
$$\hat{y} = \frac{1.38629436 * 300 + 1.14072377 * 300 + 1.26274917 * 300}{1.38629436 + 1.14072377 + 1.26274917} = 300,$$
which coincides with the prediction, we printed above for this sample.
Summary
In this article we developed an AdaBoost model for a Regression task by hand following the steps described in the separate article AdaBoost - Explained. Additionally a model was developed using sklearn. Although both models were derived for the same dataset, the final models differ due to some randomness in the algorithm and different implementations of the algorithm. This post focused on the application of the algorithm to a simplified regression example. For a detailed example for a classification task, please refer to the article AdaBoost for Classification - Example.
References
[1] Solomatine, D.P.; Shrestha, D.L., “AdaBoost.RT: a Boosting Algorithm for Regression Problems”, 2004 IEEE International Joint Conference on Neural Networks, vol.2, no., pp.1163.1168 vol.2, 25-29 July 2004, DOI: 10.1109/IJCNN.2004.1380102
If this blog is useful for you, please consider supporting.
