Logistic Regression - Explained
- 10 minutes read - 1986 wordsIntroduction
Logistic Regression is a Supervised Machine Learning algorithm, in which a model is developed, that relates the target variable to one or more input variables (features). However, in contrast to Linear Regression the target (dependent) variable is not numerical, but categorical. That is the target variable can be classified in different categories (e.g.: ’test passed’ or ’test not passed’). An idealized example of two categories for the target variable is illustrated in the plot below. The relation described in this example is whether a test is passed or not, depending on the amount of hours studied. Note, that in real world examples the border between the two classes depending on the input feature (independ variable) will usually not be as clear as in this plot.
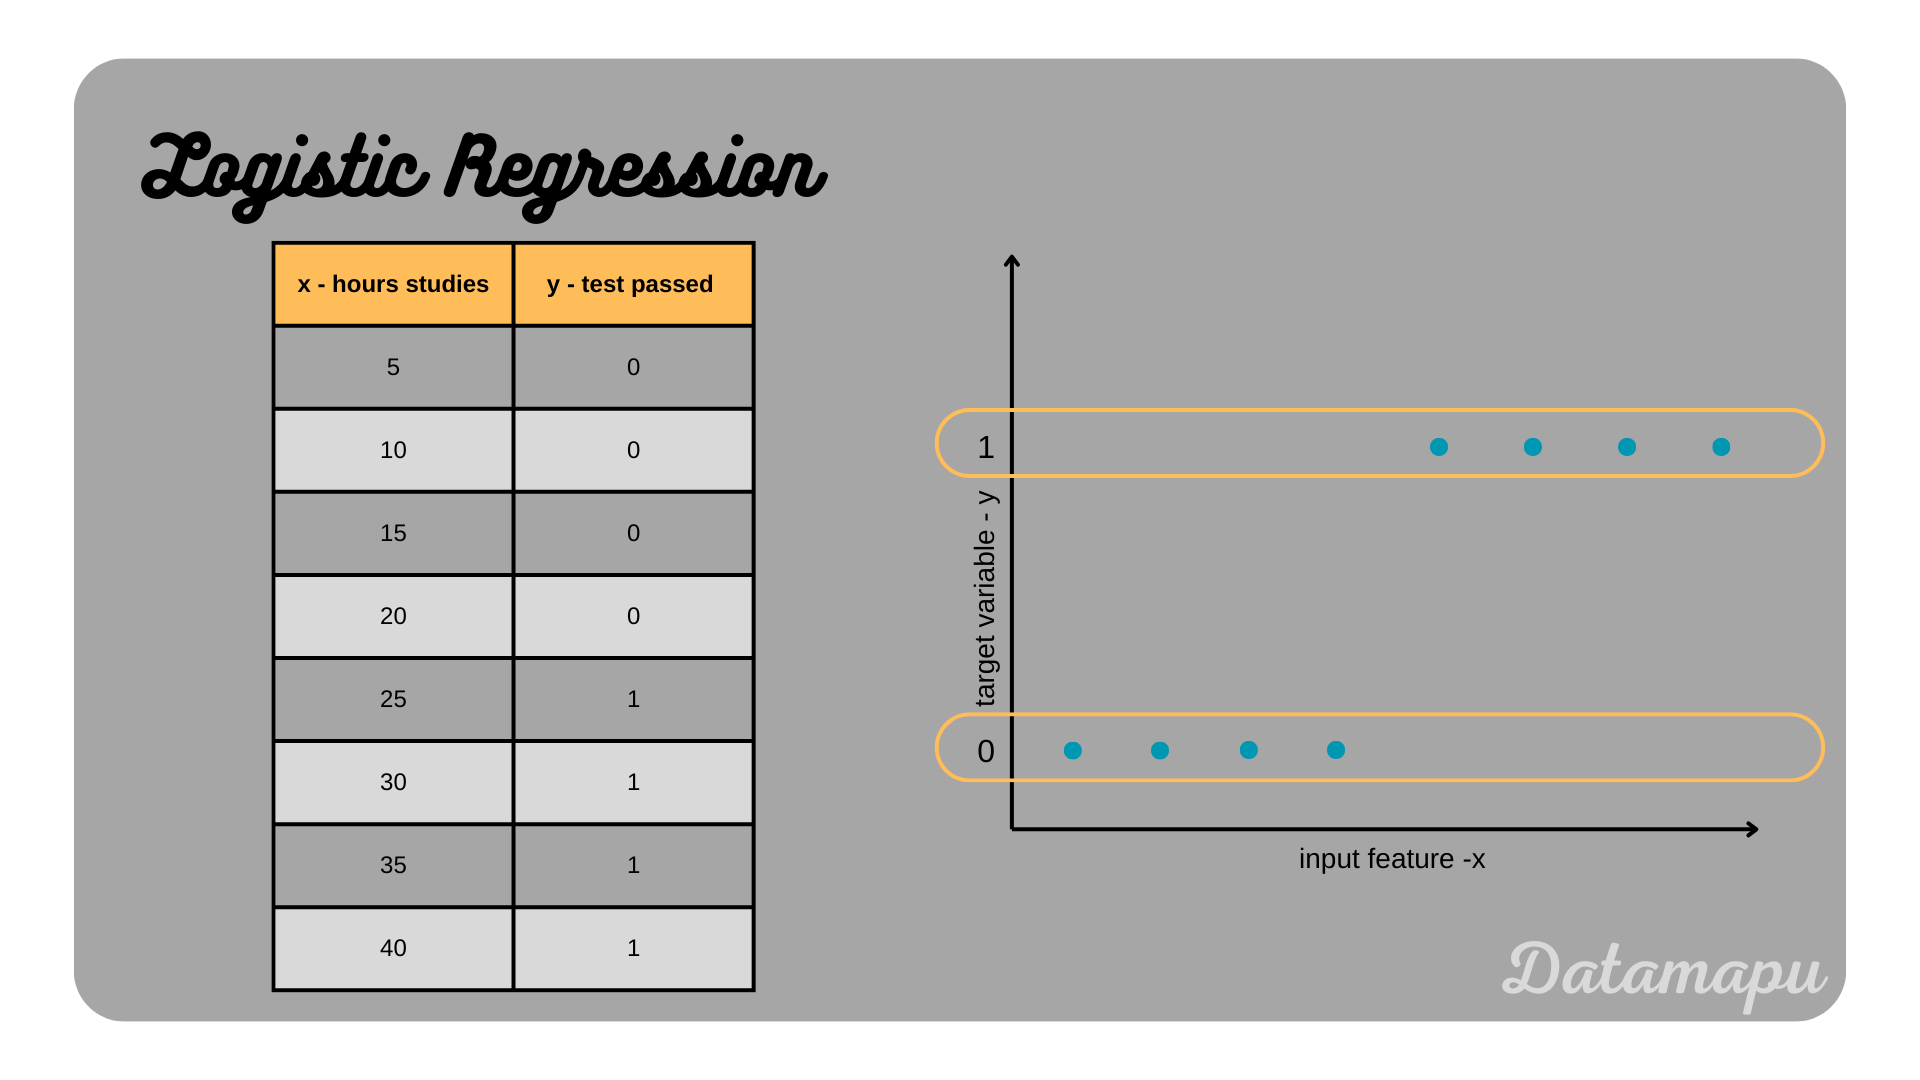 Simplified and idealized example of a logistic regression
Binary Logistic Regression
If the target variable contains two classes we speak of a Binary Logistic Regression. The target values for binary classification are usually denominated as 0 and 1. In the previous plot ’test passed’ is classified as 1 and ’test not passed’ is classified as 0. To develop a Logistic Regression model we start with the equation of a Linear Regression. First, we assume that we only have one input feature (independent variable), that is we use the equation for a Simple Linear Regression.
$$ \hat{y} = a\cdot x + b, $$
with $\hat{y}$ simulating the target values $y$ and $x$ being the input feature. Using this Linear Regression model would give us values for $\hat{y}$ ranging between $-\infty$ and $+\infty$. However, we finally want only the classes $0$ and $1$ as outputs. To achieve that we define a model that does not predict the outcome ($0$ or $1$) directly, but the probability of the event. Then this probability is mapped to the values $0$ and $1$ by defining a threshold. For probabilities below this threshold the predicted target is $0$ and for probabilities above it is $1$. Usually, this threshold is $0.5$, but it can be customized. To predict a probability the output values need to be between $0$ and $1$. A function that satisfies this is the Sigmoid function, which is defined as
$$f(z) = \frac{1}{1 + e^{-z}}.$$
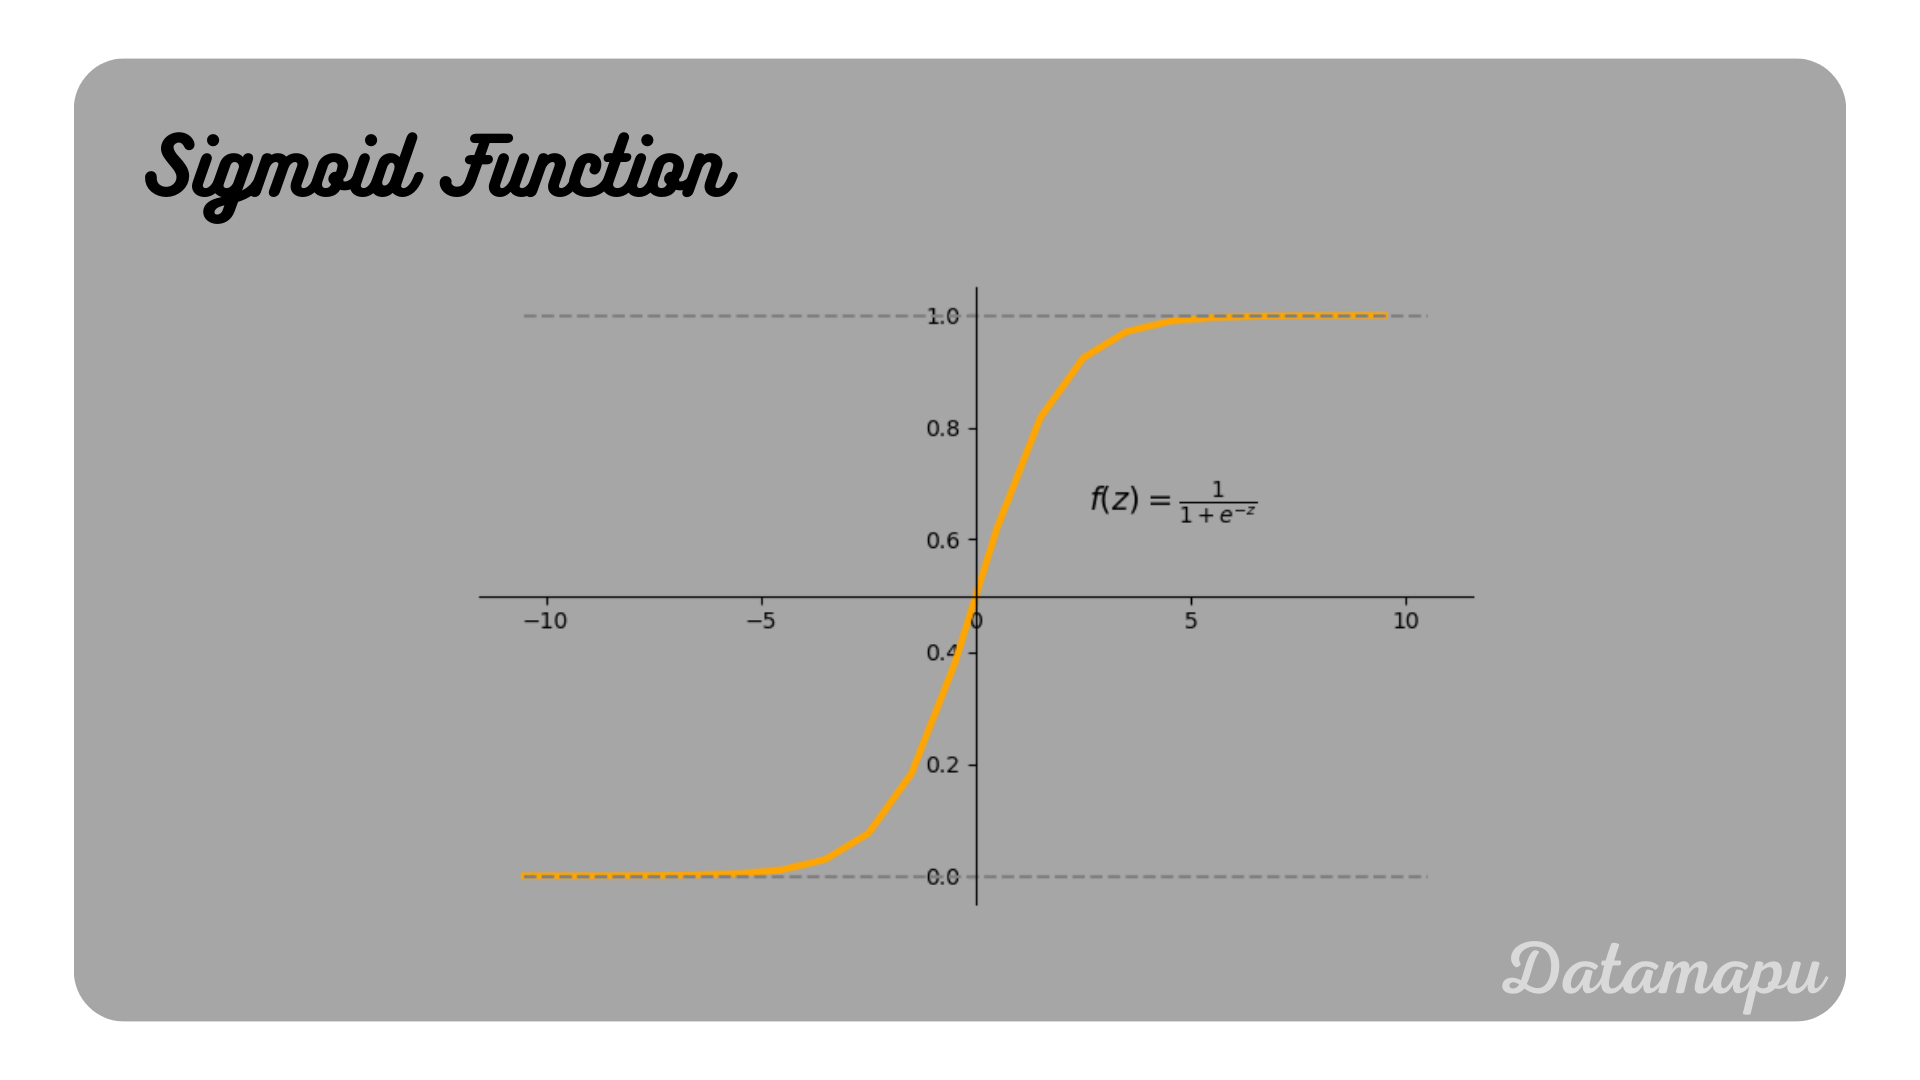 The sigmoid Function.
We then take our Linear Regression equation and insert it into the logistic equation. With that we get
$$f(x) = \hat{y} = \frac{1}{1 + e^{-(a\cdot x + b)}},$$
a Sigmoid Function depending on the parameters $a$ and $b$. How the Sigmoid Function changes depending on these parameters is illustrated below.
 The function for Logistic Regression illustrated for different parameters.
This is our final Logistic Regression model.
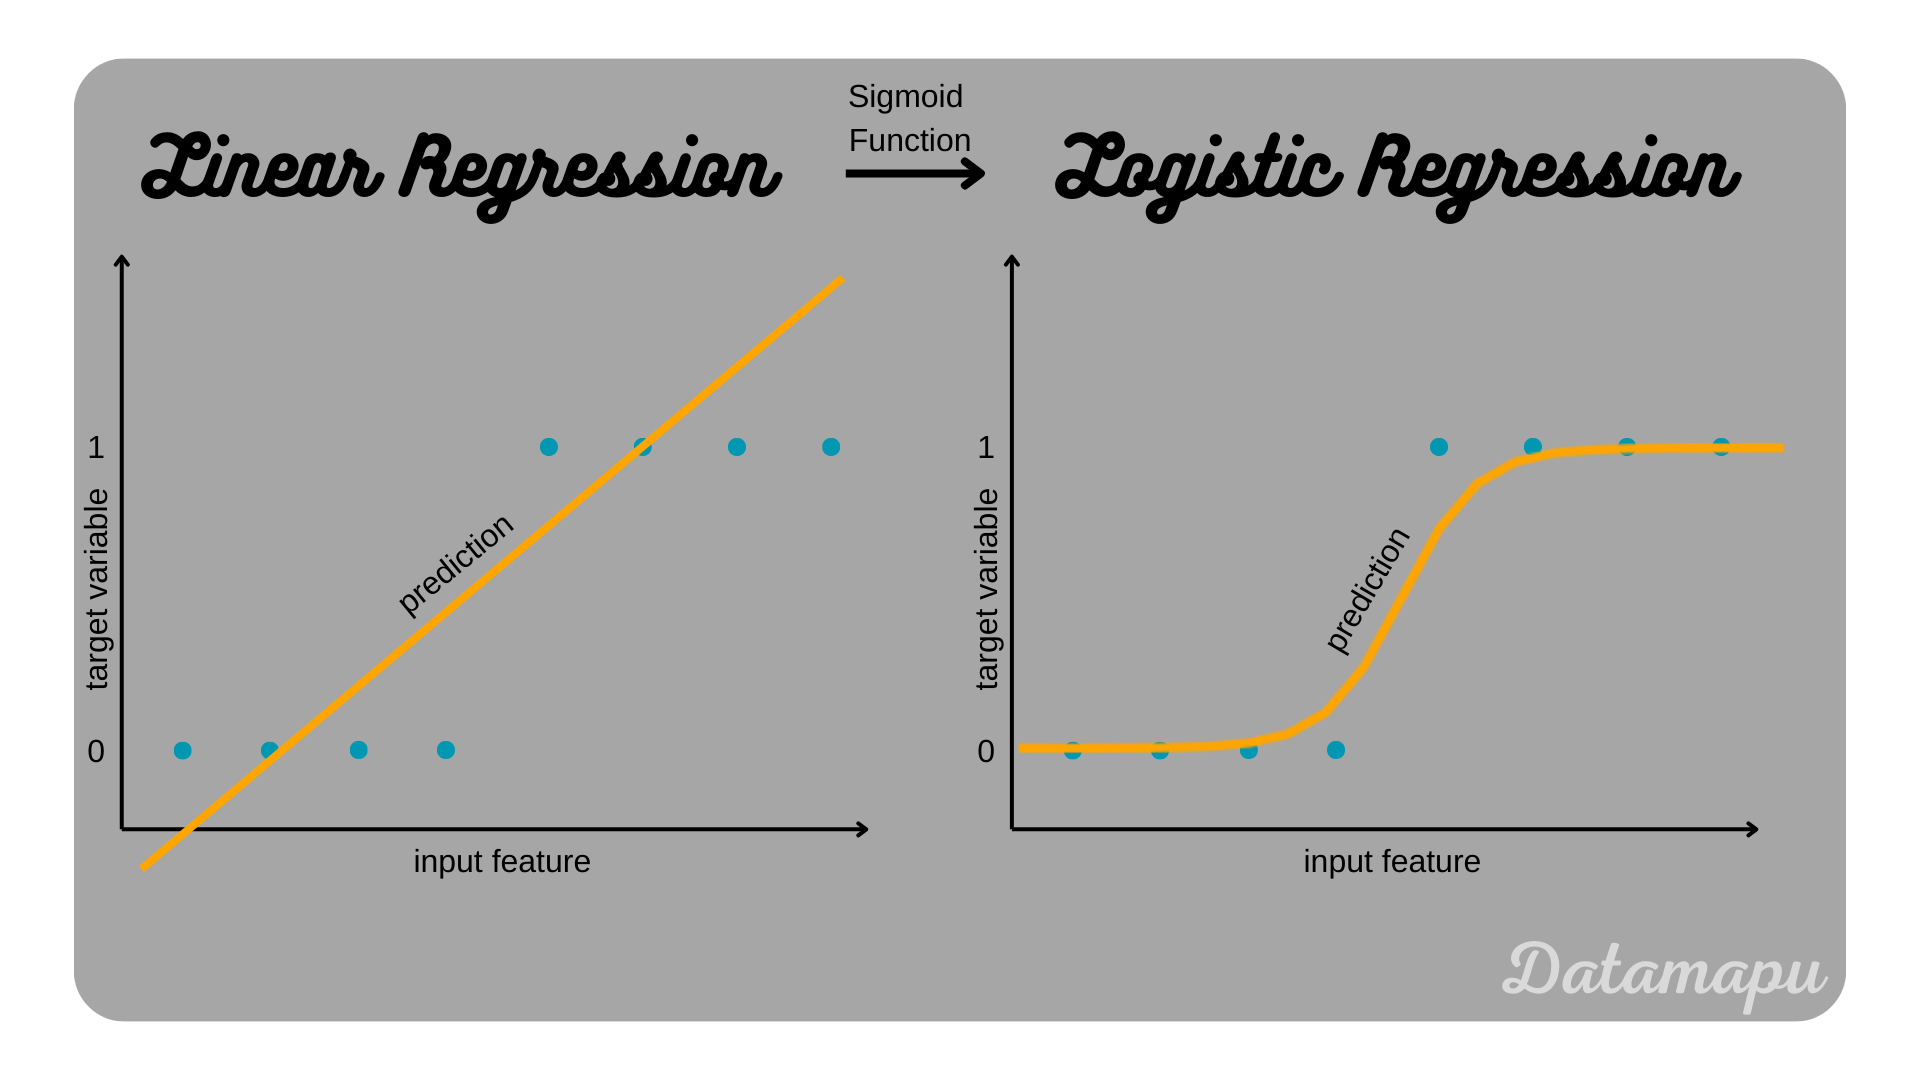 From Linear Regression to Logistic Regression
If more than one independent variable (input feature) is considered, the input features can be numerical or categorical as in a Linear Regression. The exact same idea as described above is followed, but using the equation for Multiple Linear Regression as input for the Sigmoid function. This results in
$$\hat{y} = \frac{1}{1 + e^{-(a_0 + a_1\cdot x_1 + a_2\cdot x_2 + \dots + a_n\cdot x_n)}}.$$
Multinomial Logistic Regression
If the target variable can take more than two classes, we speak of Multinomial Logistic Regression. By definition, a Logistic Regression is designed for binary target variables. If the target contains more than two classes, we need to adapt the algorithm. This can be done by splitting the multiple classification problem into several binary classification problems. The two most common ways to do that are the One-vs-Rest and One-vs-One strategies. As example consider predicting one of the animals dog, cat, rabbit, or ferret by specific criteria, that is we have four classes in our target data.
One-vs-Rest. This approach creates $m$ binary classification problems, if $m$ is the number of classes in the target data. Then each class is predicted against all the others. For the above example, four binary problems would be considered to solve the multiple classification problem.
- Classifier 1: class 1: dog, class 2: cat, rabbit, or ferret
- Classifier 2: class 1: cat, class 2: dog, rabbit, or ferret
- Classifier 3: class 1: rabbit, class 2: dog, cat, or ferret
- Classifier 4: class 1: ferret, class 2: dog, cat, or rabbit
With these classifiers, we get probabilities for each category (dog, cat, rabbit, ferret) and the maximum of these probabilities is taken for the final outcome. For example, consider the following outcome:
- Classifier 1: probability for dog (class 1): 0.5, probability for cat, rabbit, or ferret (class 2): 0.5
- Classifier 2: probability for cat (class 1): 0.7, probability for cat, rabbit, or ferret (class 2): 0.3
- Classifier 3: probability for rabbit (class 1): 0.2, probability for cat, rabbit, or ferret (class 2): 0.8
- Classifier 4: probability for ferret (class 1): 0.3, probability for dog, cat, or rabbit (class 2): 0.7
In this case, the highest probability achieves classifier 2, that is the final outcome would be a probability of $0.7$ for the class ‘cat’, which would be the predicted class.
One-vs-One. In this approach, a binary model is fitted for each binary combination of the output classes. That is for $m$ classes $m \choose 2$ models are created. For the example with four classes this results in
- Classifier 1: class 1: dog, class 2: cat
- Classifier 2: class 1: dog, class 2: rabbit
- Classifier 3: class 1: dog, class 2: ferret
- Classifier 4: class 1: cat, class 2: rabbit
- Classifier 5: class 1: cat, class 2: ferret
- Classifier 6: class 1: rabbit, class 2: ferret
To define the prediction of the multiclass classification problem from these classifiers, the number of predictions for each class is counted and the class with the highest number of correct predictions among classifiers is the final prediction. This procedure is also known as “Voting”.
Note that a disadvantage of these methods is that they require to fit multiple models, which takes long if the dataset considered is large. For the One-vs-One even more than for the One-vs-Rest method.
Find Best Fit
As in all supervised Machine Learning models we estimate the model parameters, in this case, $a_0$, $a_1$, $\dots$, $a_n$ to optimize the model. This is done by minimizing a loss function, which describes the error between the actual values and the predictions with respect to these parameters. In the case of a Linear Regression problem, this loss function is the mean squared error. For a Logistic Regression, we need to define a different loss function. A common choice is the Negative Log Likelihood Function ($NLL$), also called Cross-Entropy-Loss. The NNL Loss ($L$) is defined as follows
$$L(a_0, \dots, a_n) = - \frac{1}{k}\sum_{i=1}^k\sum_{j=1}^m y_{ij}\cdot \log{\hat{y}_{ij}},$$
with $\hat{y}_{ij}$ depending on tha parameters $a_0, \dots, a_n$; $m$, the number of classes, and $k$ the number of datapoints. To understand this better, let’s consider the case of two classes. With $\hat{y}_i$ the probability of class 1 and $1-\hat{y}_i$ the probability of class 2, the previous equation then reduces to
$$L = -\frac{1}{k} \sum_{i=1}^k (y_i \log{\hat{y}_i} + (1-y_i)\log{(1 - \hat{y}_i)}).$$
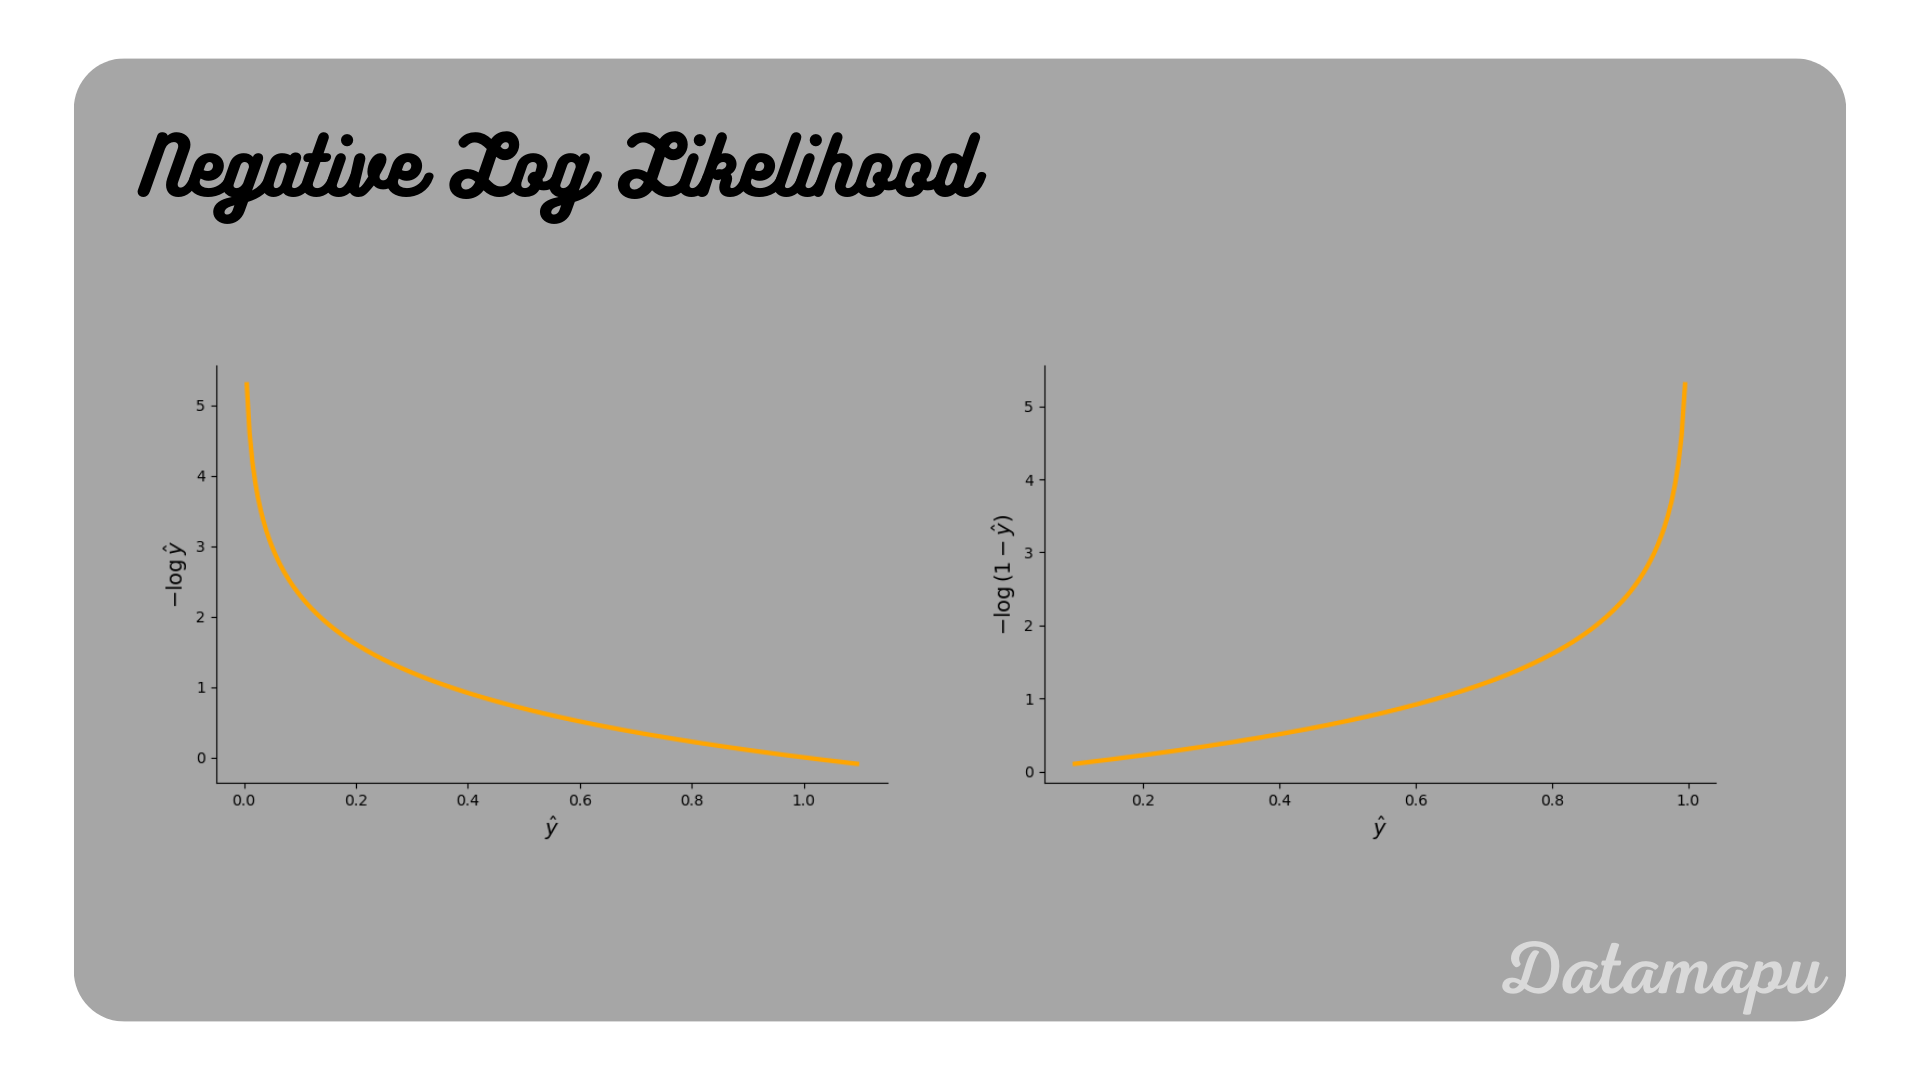
When the data sample belongs to the first class, i.e. $y_i = 1$, the second part of the equation vanishes and only the first part remains. That is for each sample of the positive class ($y_i=1$), the value $\log{\hat{y}_i}$ is added to the loss. Accordingly for the negative class ($y_i=0$), $\log{(1 - \hat{y}_i)}$ is added to the loss. Below these two functions are illustrated. They show that the log function increasingly penalizes values as they approach probabilities of the counter class. If the true (observed) value ($y_i$) is equal to $1$, and the predicted probability ($\hat{y}_i$) is close to $1$, the loss will be low, if the predicted probability is close to $0$ the loss increases. Accordingly for a true (observed) value ($y_i$) of $0$ the loss is low if the predicted probability ($\hat{y}_i$) is close to $0$ and increases when the predicted probability is closer to $1$.
Note, that minimizing the NLL is equally to maximizing the likelihood, which is also known as Maximum Likelihood Estimation. Maximizing the likelihood is more intuitive, it is however common to minimize the loss and not to maximize it. The NNL can be derived from the likelihood function. This is however out of the scope of this article.
Interpretation
To understand Logistic Regression better, let’s consider the defined model function again
$$\hat{y} = \frac{1}{1 + e^{-(a_0 + a_1\cdot x_1 + a_2\cdot x_2 + \dots + a_n\cdot x_n)}} = \frac{1}{1 + e^{-z}},$$
with $z=a_0 + a_1\cdot x_1 + a_2\cdot x_2 + \dots + a_n\cdot x_n$. Let’s rename $\hat{y} = p$ to make clearer that this is the probabilty of an event. In the example given above this event is ’test passed’. With that we can reformulate this equation to
$$p = \frac{1}{1 + e^{-z}}$$ $$p = \frac{e^z}{e^z\cdot(1 + e^{-z})}$$ $$p = \frac{e^z}{1+e^z}$$ $$p\cdot (1 + e^z) = e^z$$ $$p = (1 - p)\cdot e^z$$ $$\frac{p}{1-p} = e^z.$$
This last equation describes the chances $\frac{p}{1-p}$, also called the odds of an event. These chances are a measure for the separation of the two classes. If we take the logarithm, we get
$$\ln{\frac{p}{1-p}} = z = a_0 + a_1\cdot x_1 + a_2\cdot x_2 + \dots + a_n\cdot x_n $$
This expression is known as the log-odds. That is, although Linear Regression and Logistic Regression are used for different types of problems (regression vs. classification), they still have a lot in common. In both cases a line (one input feature) or a hyperplane (more than one input feature) is used. In a Linear Regression however this line / hyperplane is used to predict the target variable, while in Logistic Regression it is used to separate two classes. In Logistic Regression the interpreation of the coefficients $a_0$, $a_1$, $\dots$, $a_n$ however, is not as straight forward as in the case of the Linear Regression, because the relationship is not linear any more. Only the sign of the coefficients tells us if the log-odds is increases or decreases.
Evaluation
The evaluation of a Logistic Regression model can be done with any metric suitable for classification problems. The most common metrics are
Accuracy. The fraction of correct predicted items to all items. How many items were correctly classified?
Recall. The fraction of true positive items out of all actual positive items. How many items are relevant?
Precission. The fraction of true positive items out of all positive predicted items. How many of the positive predicted items are really positive?
F1-Score. The harmonic mean of Precision and Recall.
Which metric is suitable depends on the considered problem. In a separate article you can find a more detailed overview and explanation about the most common metrics for classification problems.
Example
In Python you can fit a Logistic Regression using the sklearn library. Here is a simplified example for illustration purposes:
| |
The predict_proba method gives the probabilites for each of the two classes, if we want the probabilites of a $1$ (positive class), we need to address the second row of the matrix. The results for this example are y_pred_proba[:,1] = [0.05915596, 0.15714628, 0.35603106, 0.62113094, 0.82939351, 0.97714137]. The predict method directly gives the classes with a default threshold at $0.5$. That is probabilities below $0.5$ are classified as $0$ and higher or equal to $0.5$ are classified as $1$. In this example we get y_pred= [0, 0, 0, 1, 1, 1].
You can find a more detailed elabarated example for a Logistic Regression on kaggle.
Summary
In this article we learned about Logistic Regression. Logistic Regression is a supervised Machine Learning Algorithm, that is build for binary classification, but can be extendet to multi-classification. It is based on predicting probabilites using the Sigmoid function. These probabilities are then mapped to the final target classes.
If this blog is useful for you, please consider supporting.
