The Data Science Lifecycle
- 5 minutes read - 938 wordsIntroduction
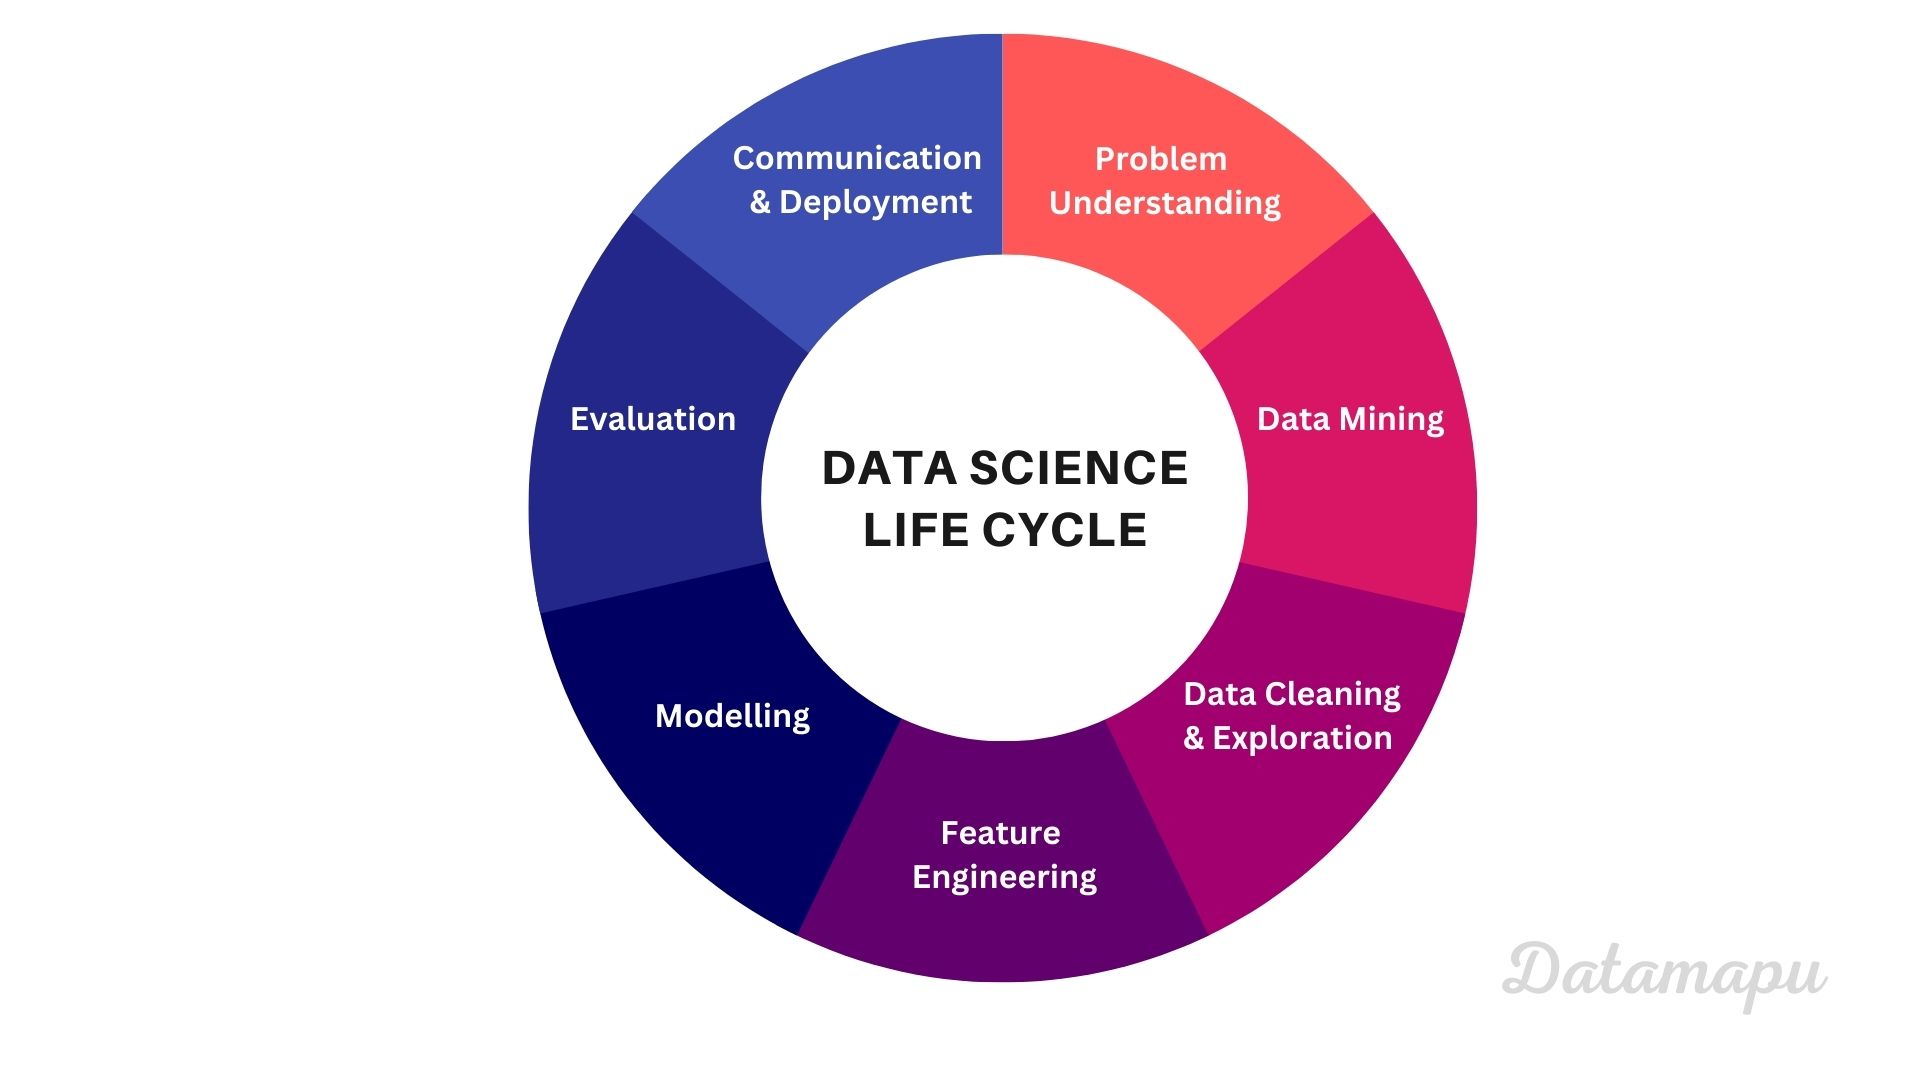
When we think about Data Science, we usually think about Machine Learning modeling. However, a Data Science project consists of many more steps. Whereas modelling might be the most fun part, it is important to know that this is only a fraction of the entire lifecycle of a Data Science project. When we plan a project and communicate how much time we need, we need to make sure that enough time is given for all the surrounding tasks. Let’s have a look at the individual steps of a Data Science project.

The Data Science Lifecycle
Before starting a project, it is important to understand the problem we want to solve. We have to make sure we understand the context and ask domain experts if necessary. This is a crucial step and should not be under estimated. This is also the time when we define the metrics we are interested in. This is an important decision as we will use them to evaluate our model and use them to make decisions.
Next, we need data. If we are not very lucky and data is provided by someone else, Data Mining might need a lot of time. We have to think about which input features we need and search for data sources to download the data. Especially if we want to use the data for commercial purposes, we have to check their license.
Usually, data downloaded from the internet needs to be cleaned. This includes searching for missing values, outliers or renaming columns. Sometimes we have to reformat the entries, e.g. decimal numbers might be separated by a comma, but you want to process them separated with a dot. Also, we should have a look at the data types. Maybe we want to change them, especially when we are working with dates. Before using the data for modelling we should explore them. This step depends on our data and the problem we want to solve. If we are solving a classification problem, we should have a look at the distributions of the data classes in the target data, to check if our data is unbalanced. If our problem is a regression, plot the target distribution to see if it follows a normal distribution or is skewed. If the target data is skewed, we may want to try to make a logarithmic transformation to it, before modelling. If we have tabular data, we should also have a look at the distributions of our input features. A heatmap can show you possible correlations within your input data.
Sometimes we don’t have the exact feature you would like to use for training in our data, then we need to do feature engineering. This can be a combination of two or more features we extracted or a statistical value, like e.g. the mean or the standard deviation of one or more columns. If our feature space is very large, we can consider reducing the dimensionality at this point by e.g. performing a PCA or t-SNE. If we work with time series data, we may want to use the spectral components resulting from the FFT as input features instead of the time series data itself. In general, feature engineering is more important for classical Machine Learning algorithms and is only rarely applied when a Deep Learning algorithm is used.
When the data is prepared, finally the modelling can start. This is the point everyone is waiting for. We divide our data into training, validation and test data and start modelling. This is a very iterative process. We can try different model types to see which one performs best on our data, and of course, different hyperparameter combinations. Sometimes an ensemble model, compiled from different models, gives a better and less overfitting result.
When we finish modelling, we need to evaluate our results. A first impression is often given by the metric of the model. We should, however, do a more detailed analysis of the results, including some plots of the predictions. This gives us the opportunity to spot any conspicuity in the results. Maybe we realize that our model is constantly predicting lower values than the true values or if we are working with data at different geographical locations we may notice that our model does not perform as well at some of the locations than at others. We will probably go back again to the previous step and make some adjustments to the model or even to the input features to analyze whether these changes improve your results.
When we are finally happy with our result or simply think we cannot improve, at least not with the given data we need to communicate our results. For that, usualy, the plots and calculations you made during the evaluation are very helpful. If we want to show our model life and in action, you can think of preparing a streamlit dashboard. Once everyone is convinced, the model needs to be deployed so that it can finally be used. How to deploy a model is a whole chapter of its own and is usually done with the help of an MLOps colleague.
Summary
In this post, we learned about the individual steps in a Data Science / Machine Learning project and that it consists of much more than only modelling. These steps are not only important to know for the Data Scientist, but also to the person the results are reported to. It is important to make clear that each of these steps needs time so that expectations of the time line are clear to everyone.
If this blog is useful for you, please consider supporting.
