AdaBoost for Classification - Example
- 8 minutes read - 1589 wordsIntroduction
AdaBoost is an ensemble model that is based on Boosting. The individual models are so-called weak learners, which means that they have only little predictive skill, and they are sequentially built to improve the errors of the previous one. A detailed description of the Algorithm can be found in the separate article AdaBoost - Explained. In this post, we will focus on a concrete example for a classification task and develop the final ensemble model in detail. A detailed example of a regression task is given in the article AdaBoost for Regression - Example.
Data
The dataset used in this example contains only 10 samples, to make the calculations by hand more feasible. It describes the problem of whether a person should go rock climbing or not, depending on their age, and whether the person likes height and goats. This dataset was also in the article Decision Trees for Classification - Example, which makes comparisons easier. The data is described in the plot below.
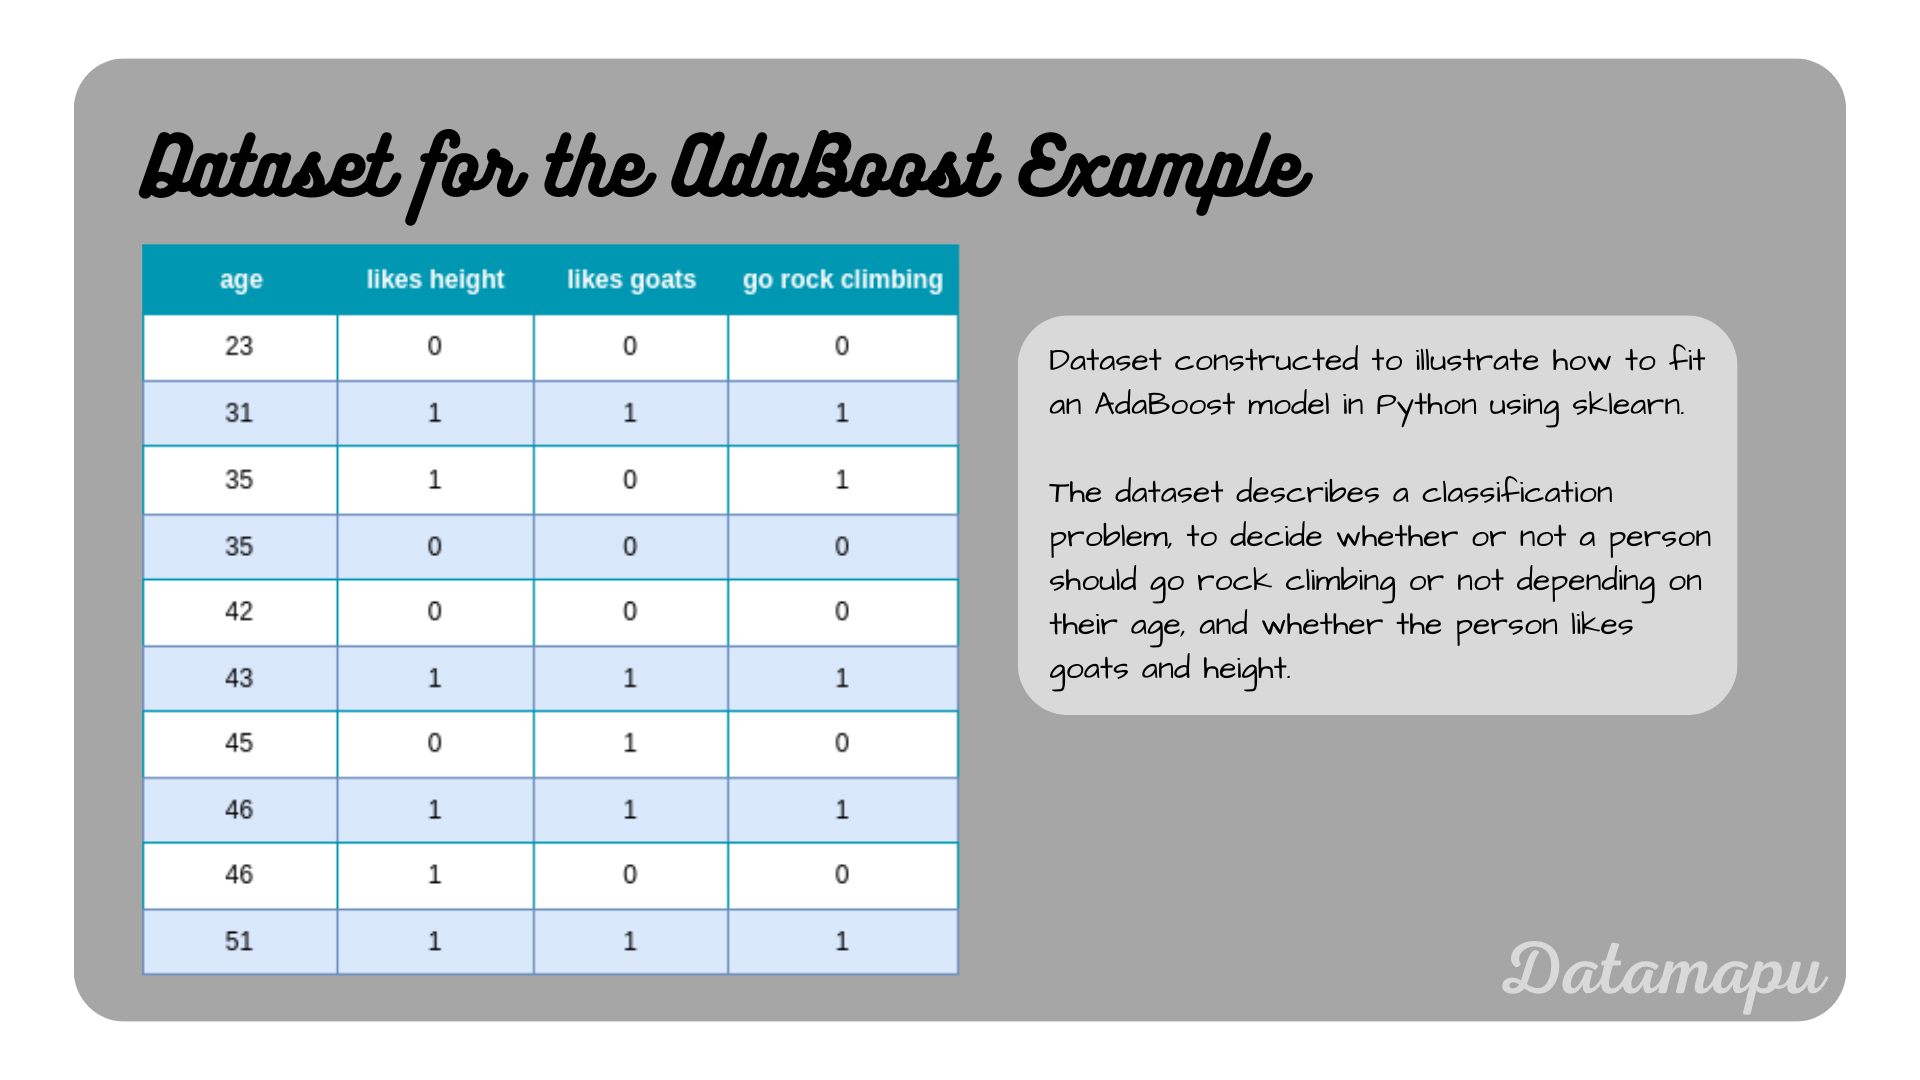 Dataset used to develop an AdaBoost model.
Build the Model
We build an AdaBoost model, constructed of Decision Trees as weak learners because this is the most common application. The underlying trees have depth one, that is only the stump of each tree is used as a weak learner. This is also the default configuration in sklearn, which we can use to fit a model in Python. Our ensemble model will consist of three weak learners. This number is chosen low for demonstration purposes.
The first step in building an AdaBoost model is assigning weights to the individual data points. In the beginning, for the initial model, all data points get the same weight assigned, which is $\frac{1}{N}$, with $N$ the dataset size.
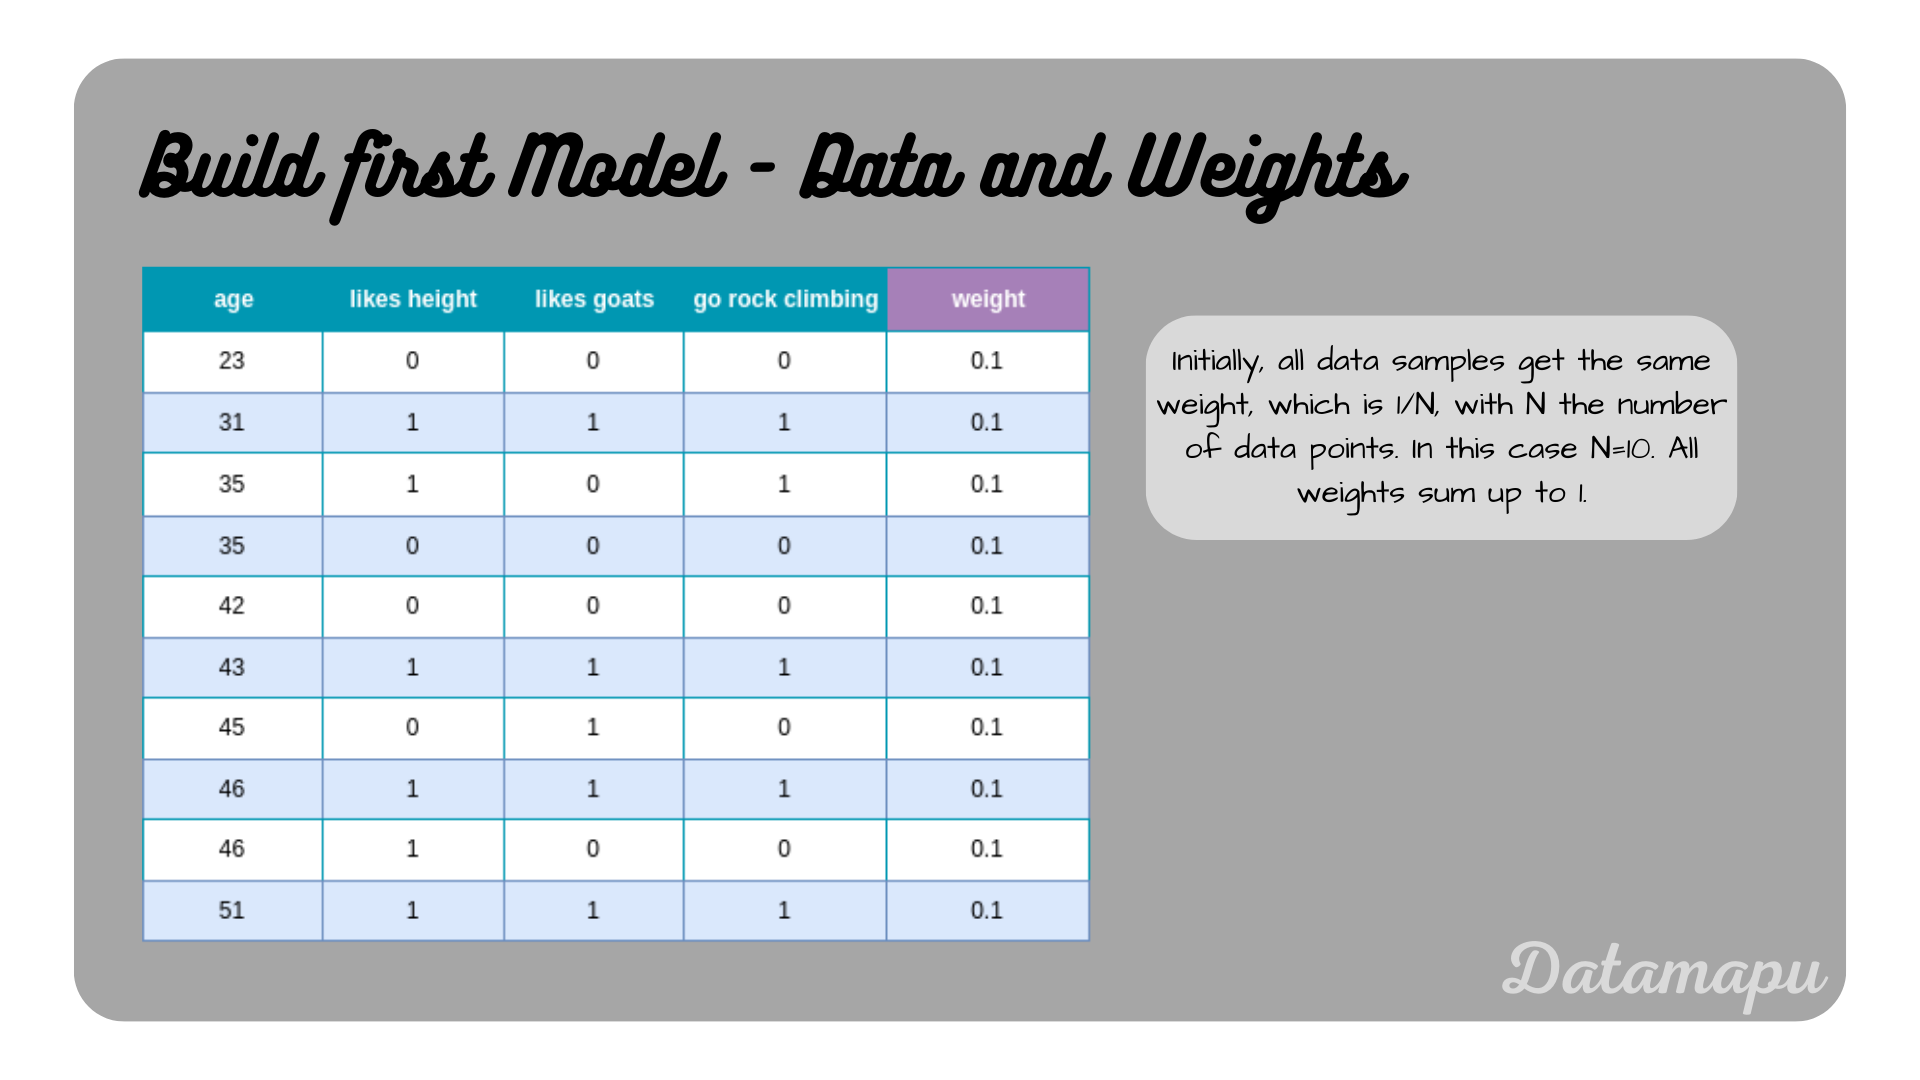 Initial dataset and weights for the example.
We now start with fitting a Decision Tree to this data. As stated earlier we will use decision stumps, that is we are only interested in the first split. The same data was used in Decision Trees for Classification - Example to develop a Decision Tree by hand, please check there for the details on how to develop a Decision Tree and how to find the best split. The resulting stump is shown in the following plot. In AdaBoost, each underlying model - in our case decision stumps - gets a different weight, which is the so-called influence $\alpha$. The influence depends on the Total Error of the model, which is equal to the number of wrongly classified samples divided by the total number of samples. The influence is defined as
$$\alpha = \frac{1}{2} \ln\Big(\frac{1 - TotalError}{TotalError}\Big).$$
 The first stump, i.e. the first weak learner for our AdaBoost algorithm.
With the influence $\alpha$ calculated, we can determine the new weights for the next iteration.
$$w_{new} = w_{old}\cdot e^{\pm\alpha}.$$
The sign in this equation depends on whether a sample was correctly classified or not. For correctly classified samples, we get
$$w_{new} = 0.1\cdot e^{-1.099} = 0.0333,$$
and for wrongly classified samples
$$w_{new} = 0.1\cdot e^{1.099} = 0.3,$$
accordingly. These weights still need to be normalized, so that their sum equals $1$. This is done, by dividing by their sum. The next plot shows the dataset with the new weights.
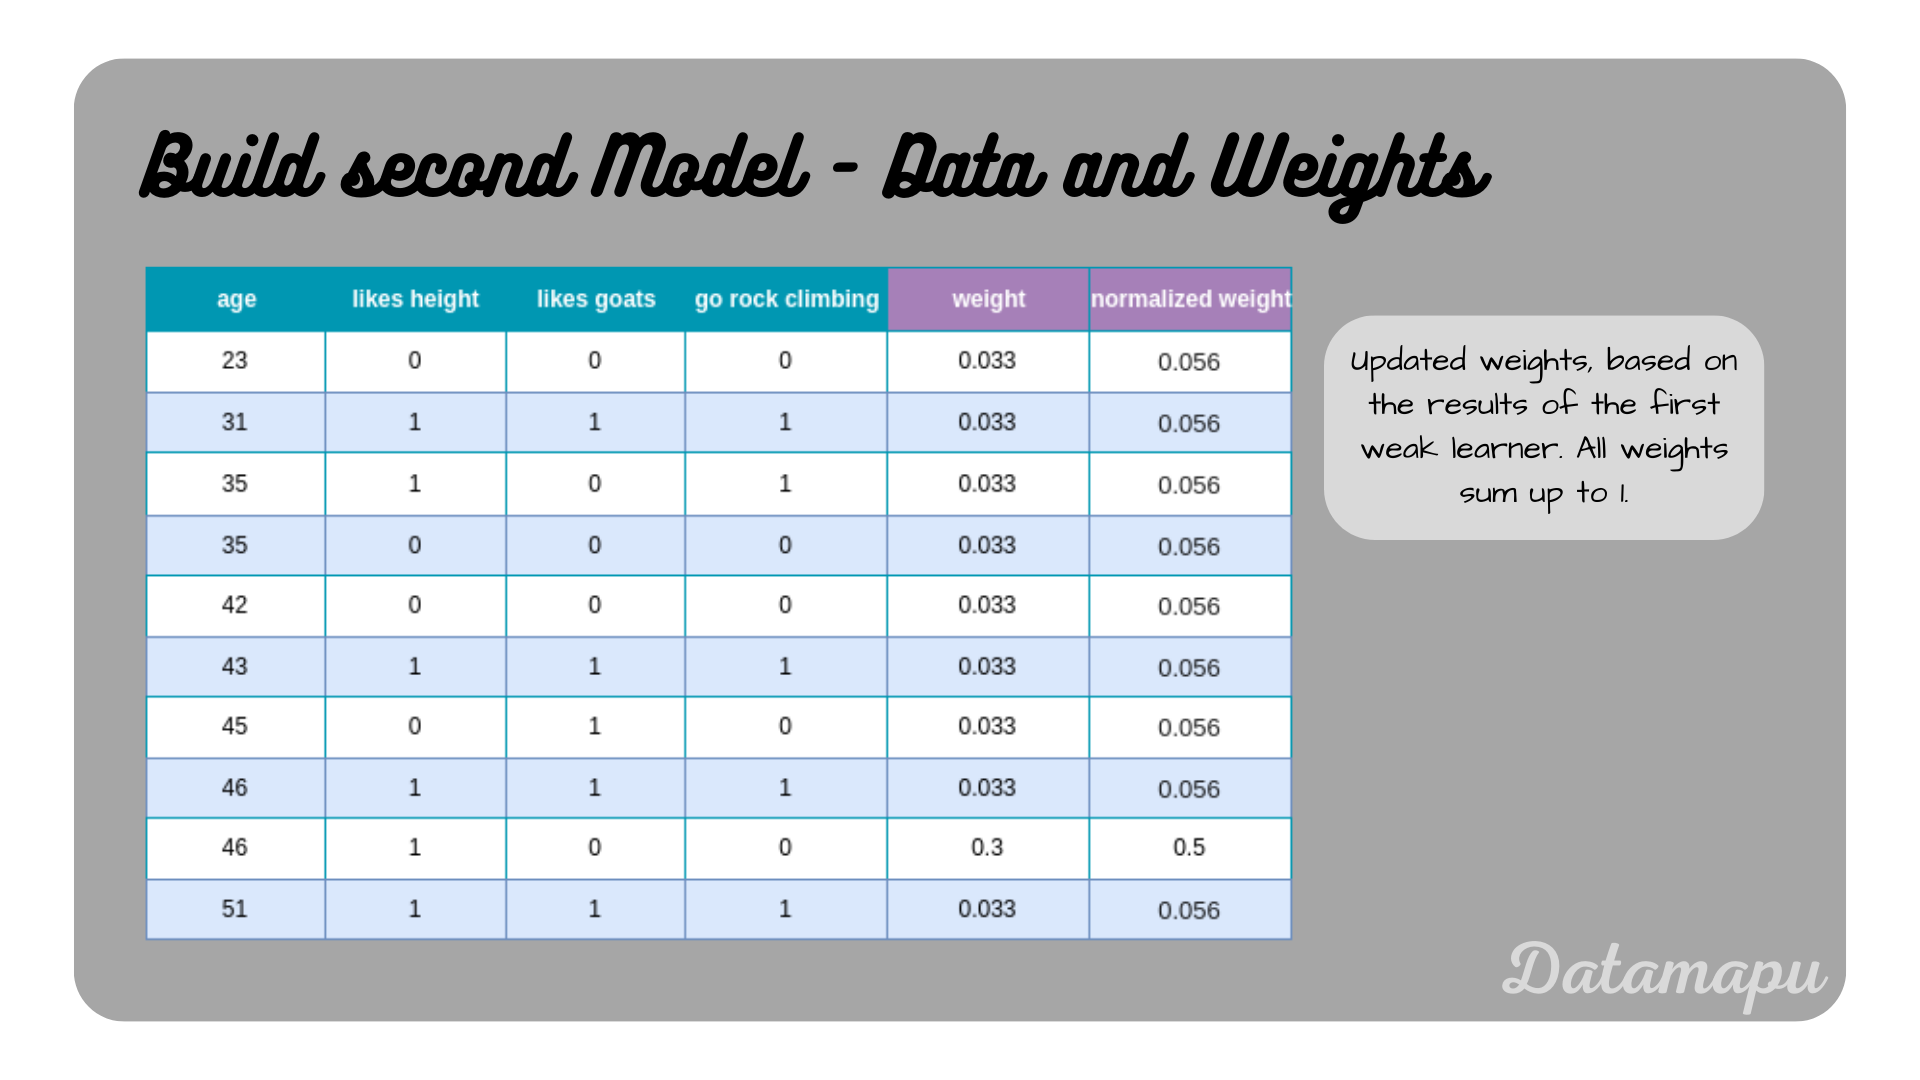 The dataset with updated weights based on the influence $\alpha$.
The weights are used to create bins. Let’s assume we have the weights $w_1, w_2, \dots, w_N$, the bin for the first sample is $[0, w_1]$, for the second sample, $[w_1, w_1+w_2]$, etc. In our example, the bin of the first sample is $[0, 0.056]$, for the second $[0.056,0.112]$, etc.. The following plot shows all samples with their bins.
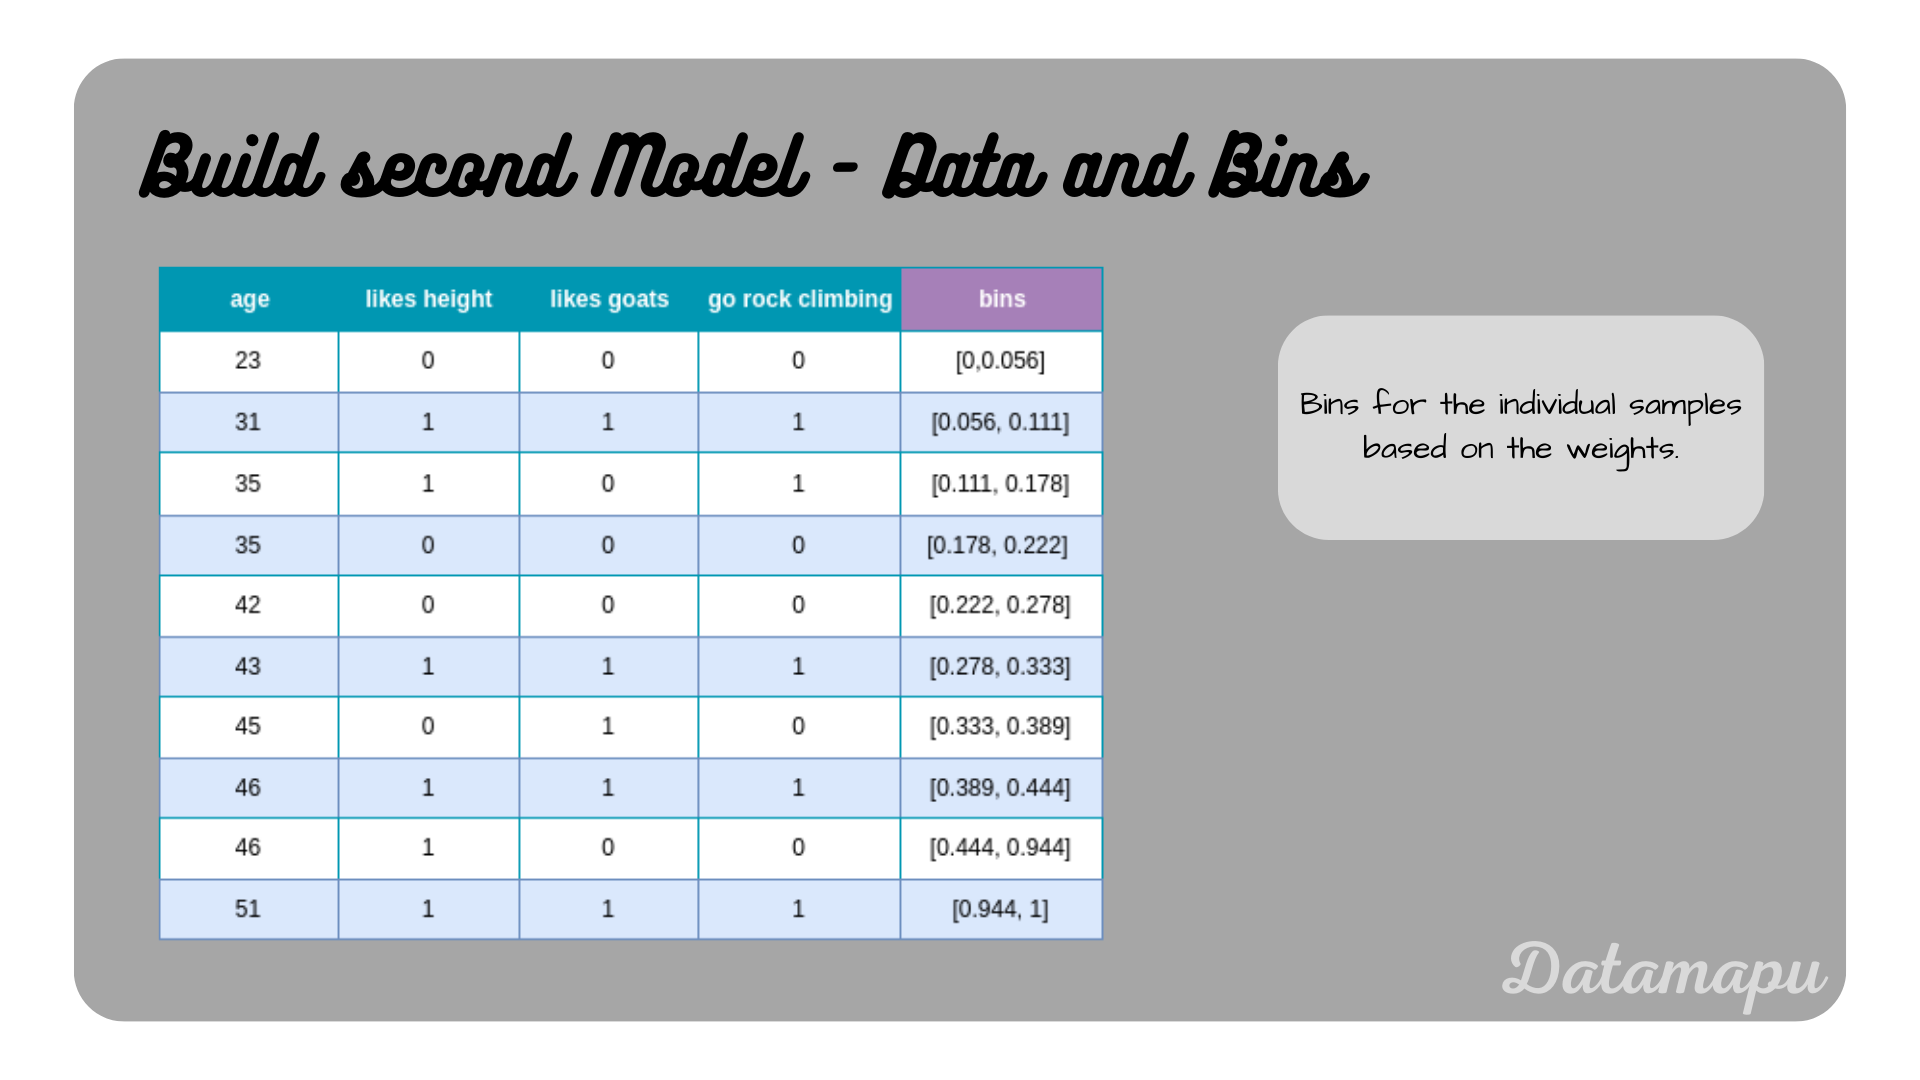 The dataset with bins based on the weights.
Now, some randomness comes into play. Random numbers between $0$ and $1$ are drawn, then we check in which bin the random number falls, and the according data sample is selected for the new modified dataset. We draw as many numbers as the length of our dataset is, that is in this example we draw $10$ numbers. Due to the higher weight of the misclassified example, this example has a larger bin, and the probability of drawing it is higher. Let’s assume we draw the numbers $[0.1, 0.15, 0.06, 0.5, 0.65, 0.05, 0.8, 0.7, 0.95, 0.97]$, which leads to the selection of the samples $[1, 2, 1, 8, 8, 0, 8, 8, 9, 9]$. The modified dataset then has the following form.
 Modified dataset to build the second stump.
We now use this modified dataset to create the second stump. Following the steps described in Decision Trees for Classification - Example, we achieve the following decision stump. Additionally, the influence $\alpha$ of this stump is calculated.
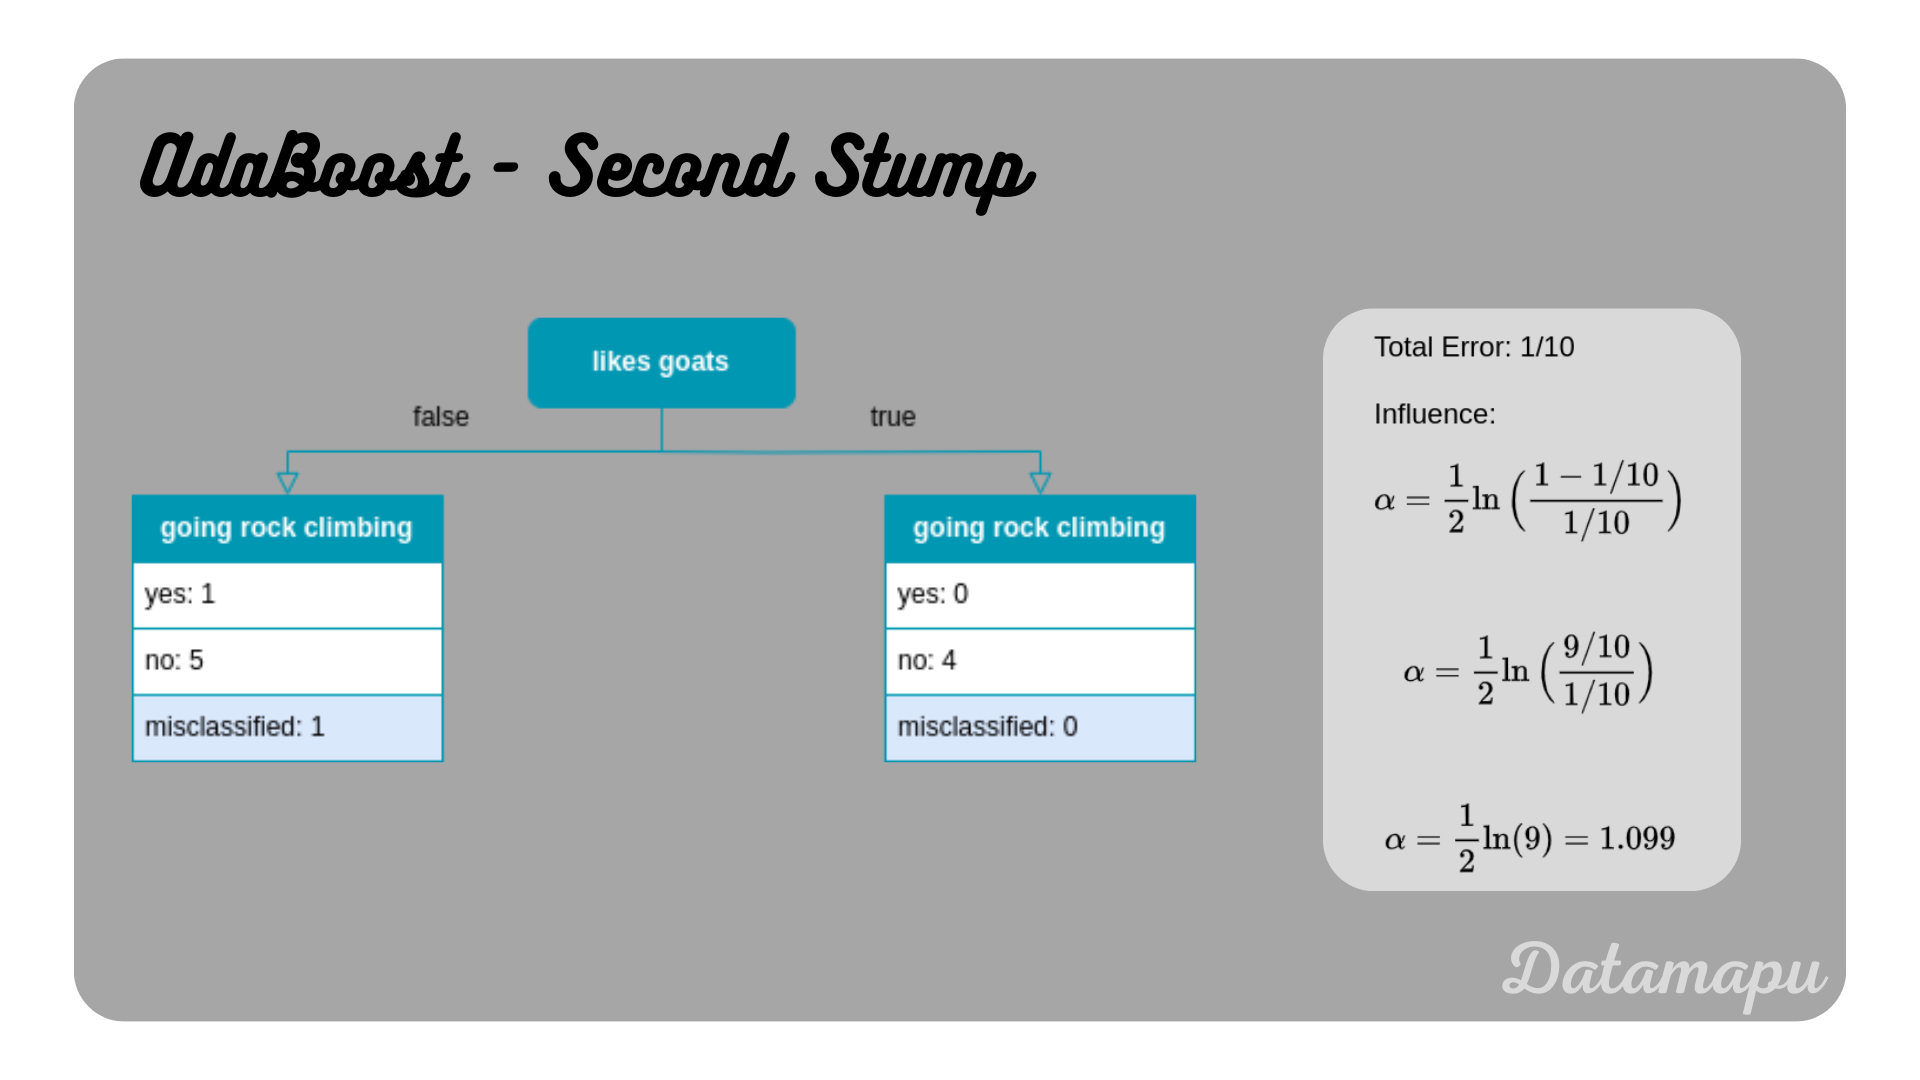 The second stump, i.e. the second weak learner for our AdaBoost algorithm.
As in the first stump, one sample is misclassified, so we get the same value for alpha as for the first stump. Accordingly, the weights are updated using the above formula.
$$w_{new} = w_{old}\cdot e^{\pm\alpha}.$$
For the first sample, this results in
$$w_{new} = 0.056 \cdot e^{-1.099} = 0.0185.$$
The second sample was the only one misclassified, so the sign in the exponent needs to be changed
$$w_{new} = 0.056 \cdot e^{1.099} = 0.167.$$
The following plot shows all samples together with their old weights, new weights, and normalized weights.
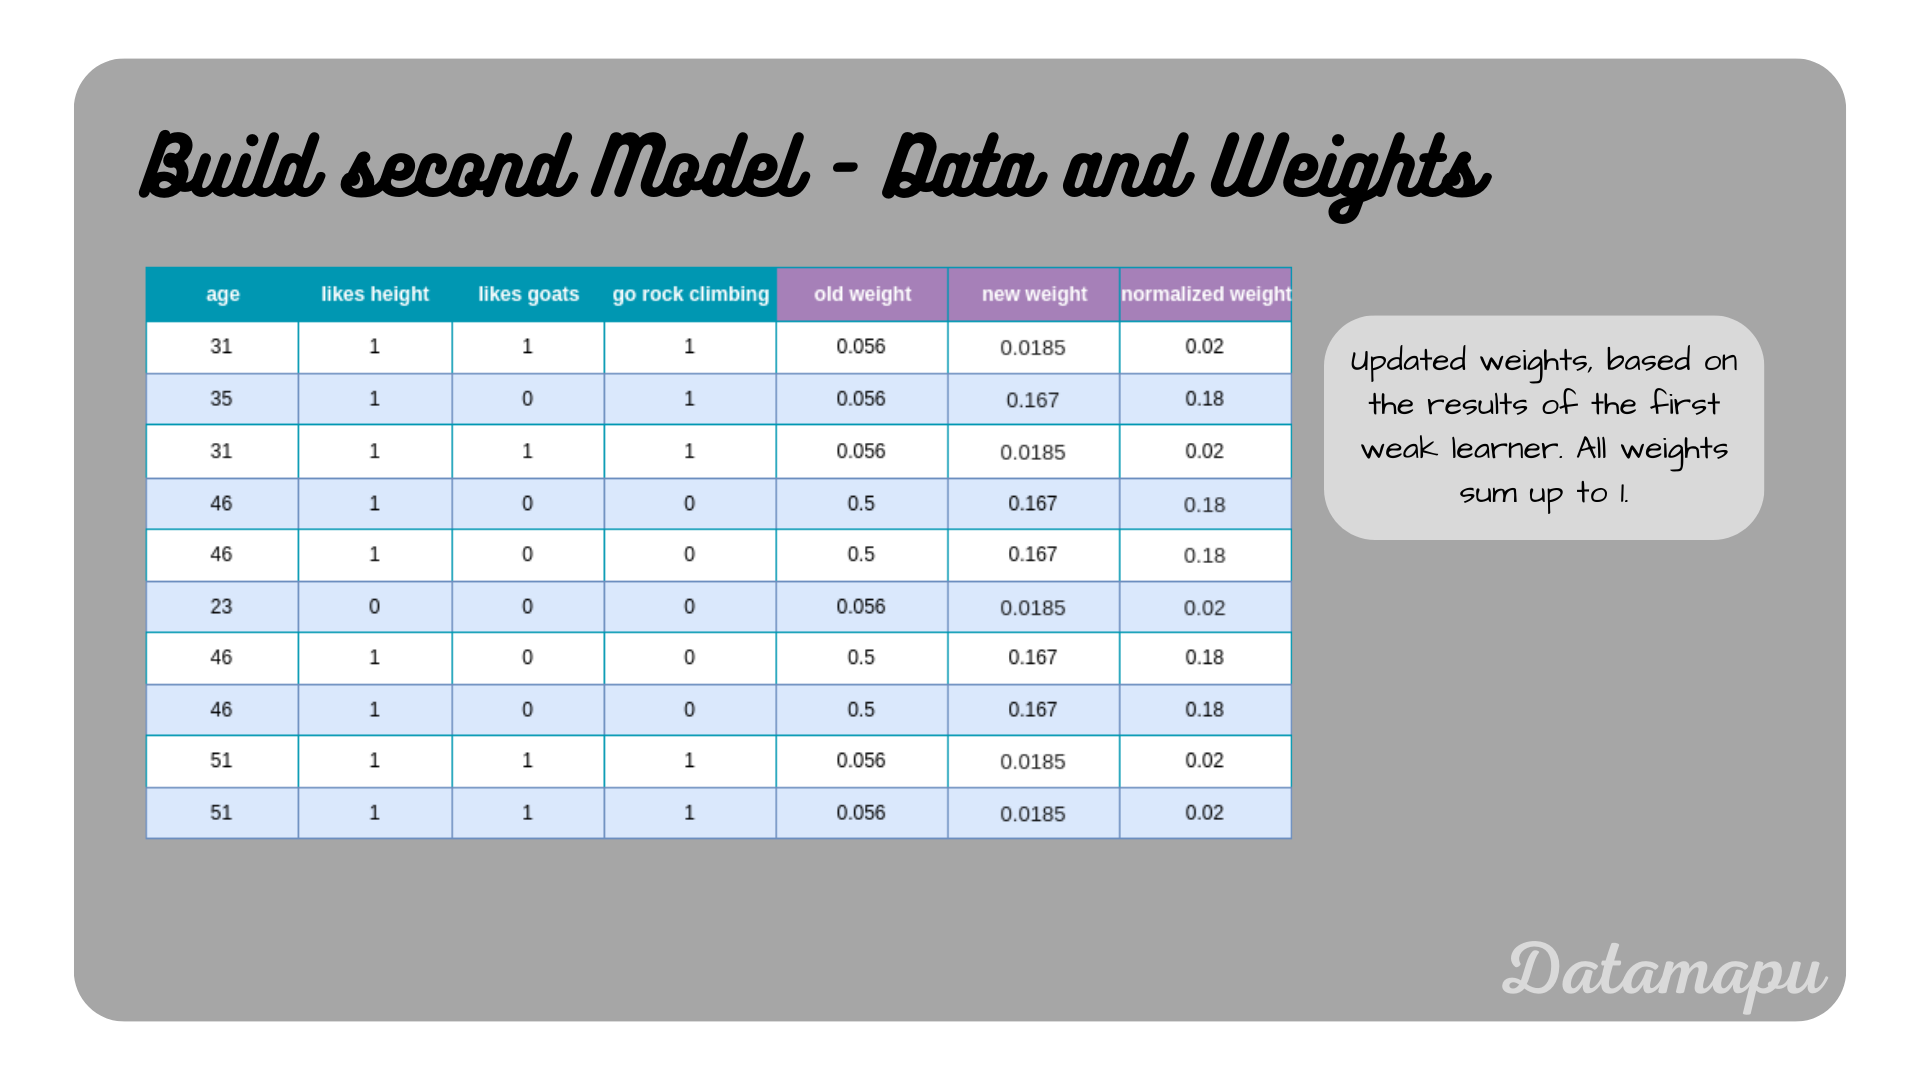 The dataset with updated weights based on the influence $\alpha$.
As in the first iteration, we convert the weights into bins.
 The modified dataset with bins based on the weights.
We repeat the bootstrapping and draw $10$ random numbers between $0$ and $1$. Let’s assume we draw the numbers $[0.3, 0.35, 0.1, 0.4, 0.97, 0.8, 0.9, 0.05, 0.25, 0.05]$, which refer to the samples $[4, 4, 1, 4, 9, 7, 7, 1, 3, 1]$, then we get the following modified dataset.
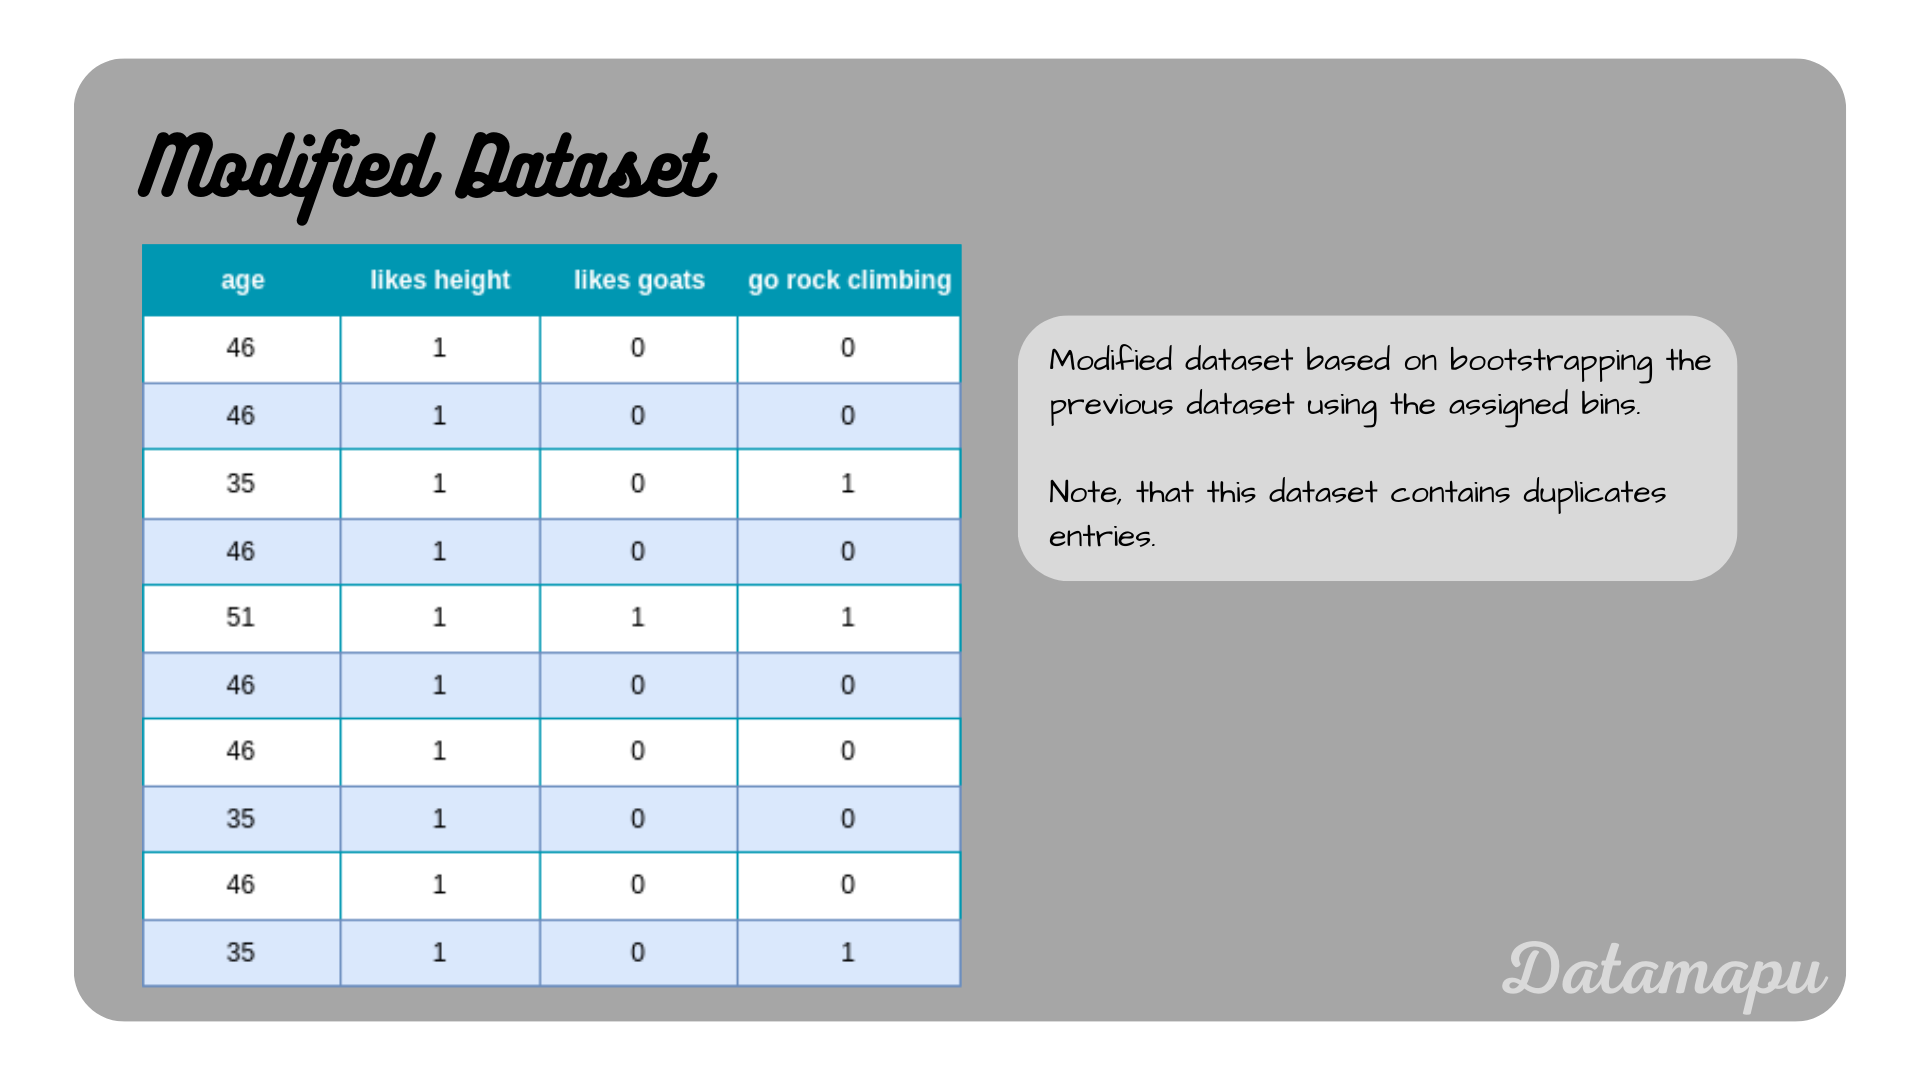 Modified dataset based on the weights.
We can now fit the third and last stump of our model to this modified dataset and calculate its influence. The result is shown in the next plot.
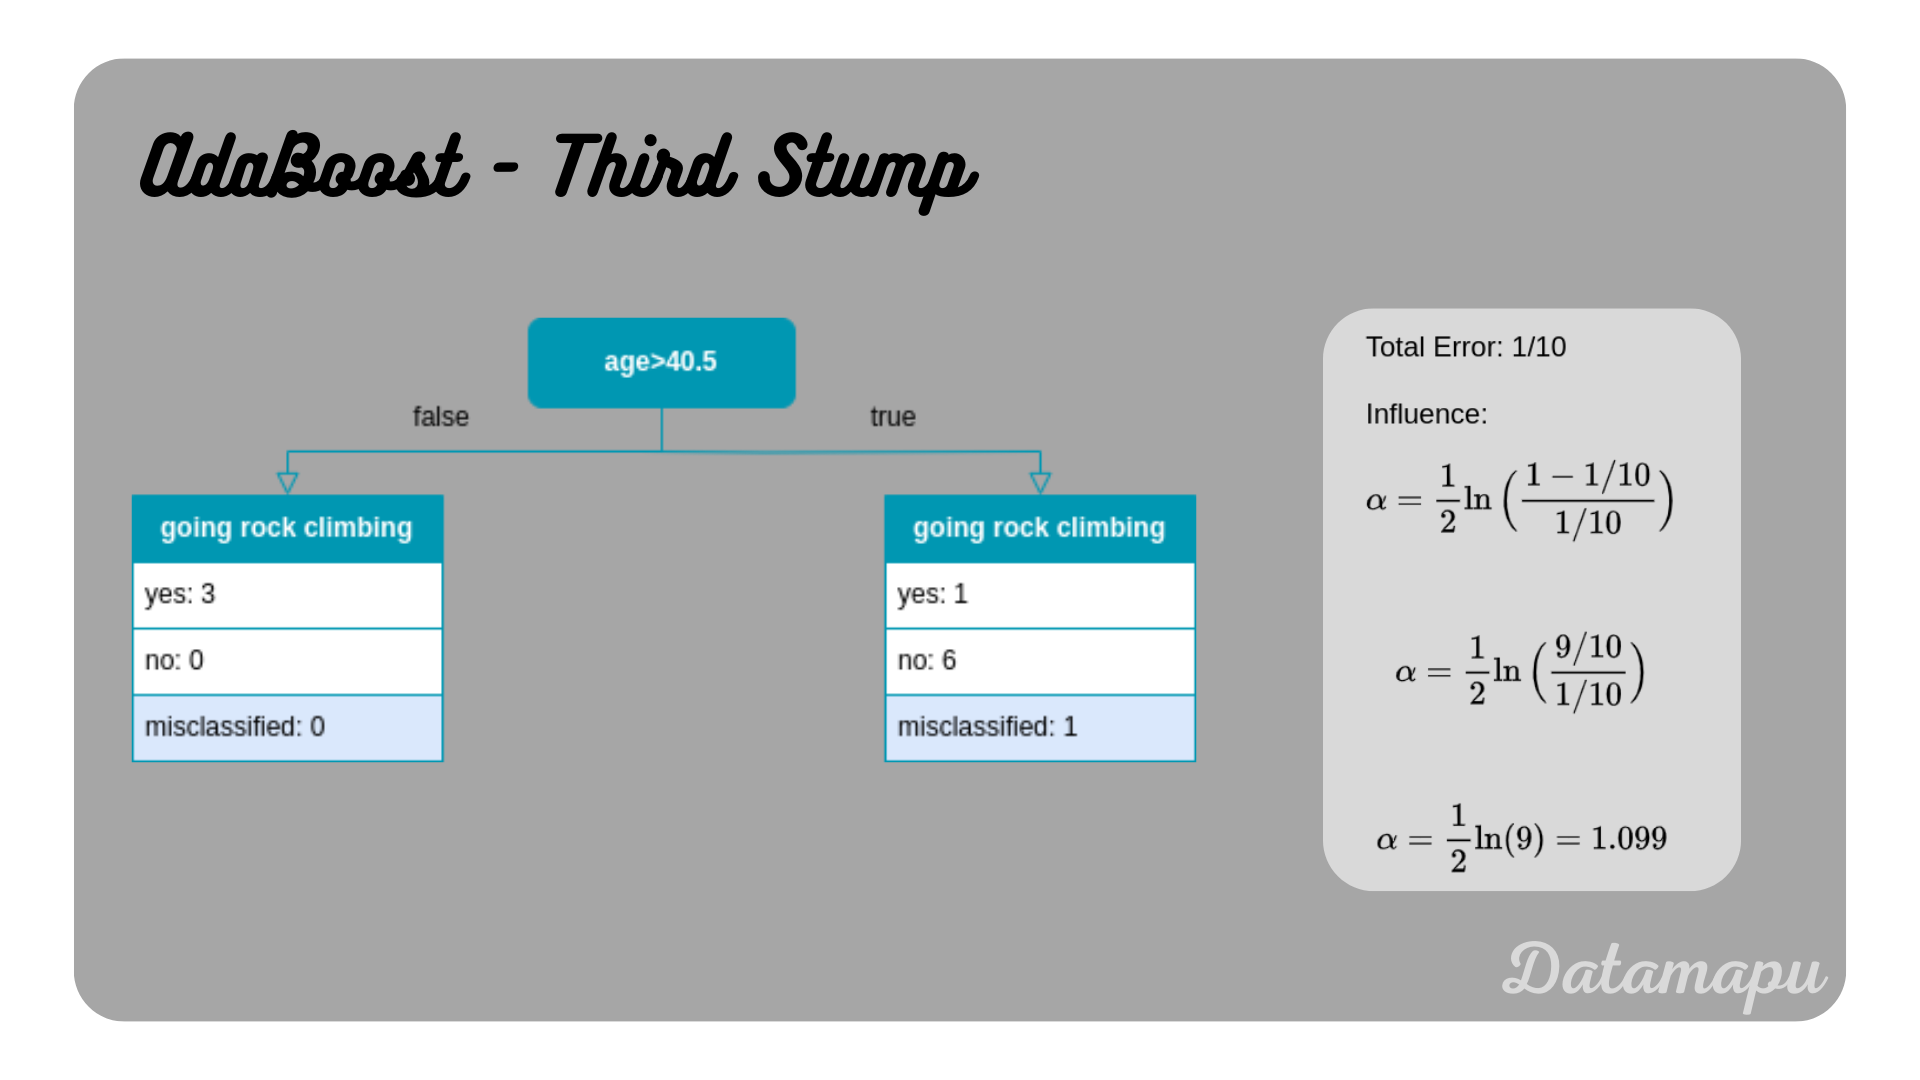 The third stump, i.e. the last weak learner for our AdaBoost algorithm.
Again, one sample is misclassified, which leads to the same influence $\alpha$ as previously. Note, that this is due to the very simplified dataset considered, in a more realistic example the influences of the different models would differ. We now use the individual trees and their calculated values $\alpha$ to determine the final prediction. Let’s consider one of the samples in the dataset.
| Feature | Value |
|---|---|
| age | 35 |
| likes height | 1 |
| likes goats | 0 |
We now make predictions for each of the three stumps for this sample.
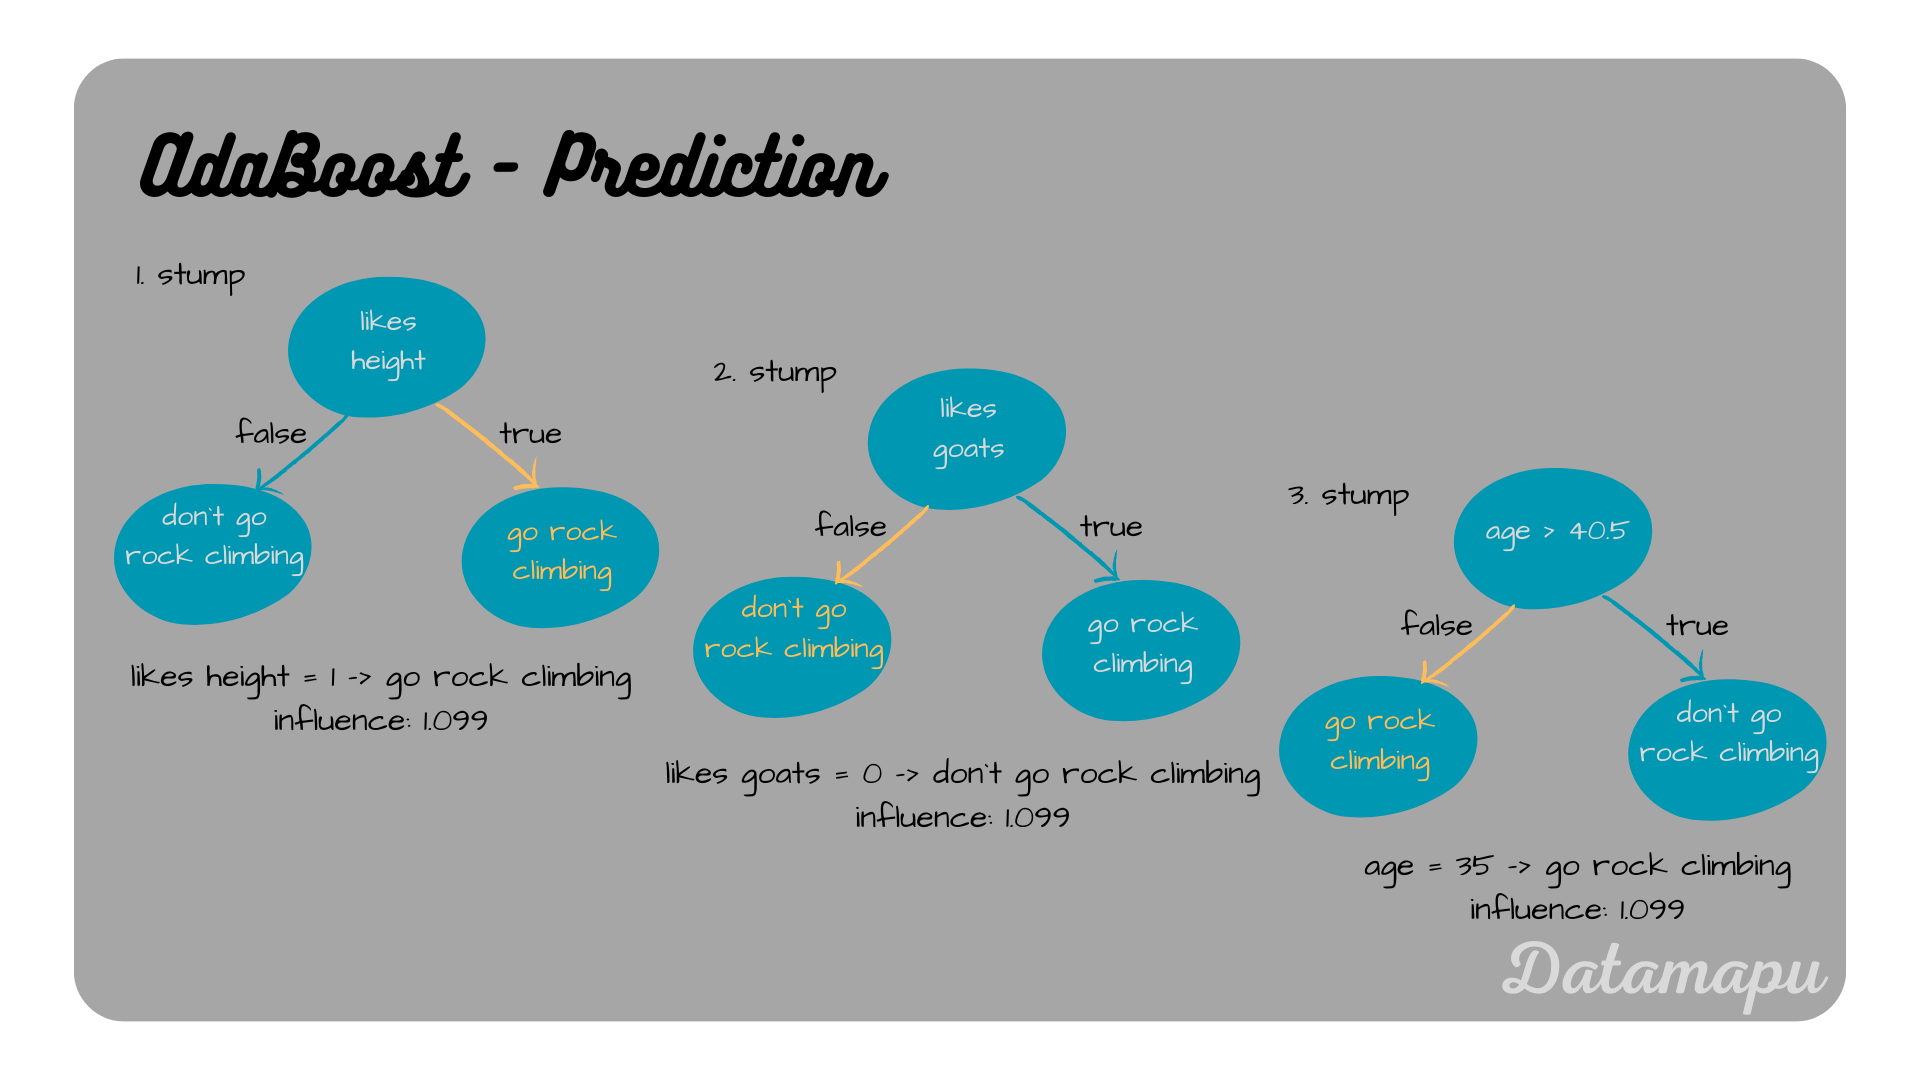 The three underlying models and their predictions for the sample.
The final prediction is achieved by adding up the influences of each tree for the predicted classes. In this example the first and the third stump predict “go rock climbing” and the second stump predicts “don’t go rock climbing”. The first and the third stump have an influence of $1.099 + 1.099 = 2.198$, and the second stump has an influence of $1.099$. That means the influence for the prediction “go rock climbing” is higher and this is thus our final prediction.
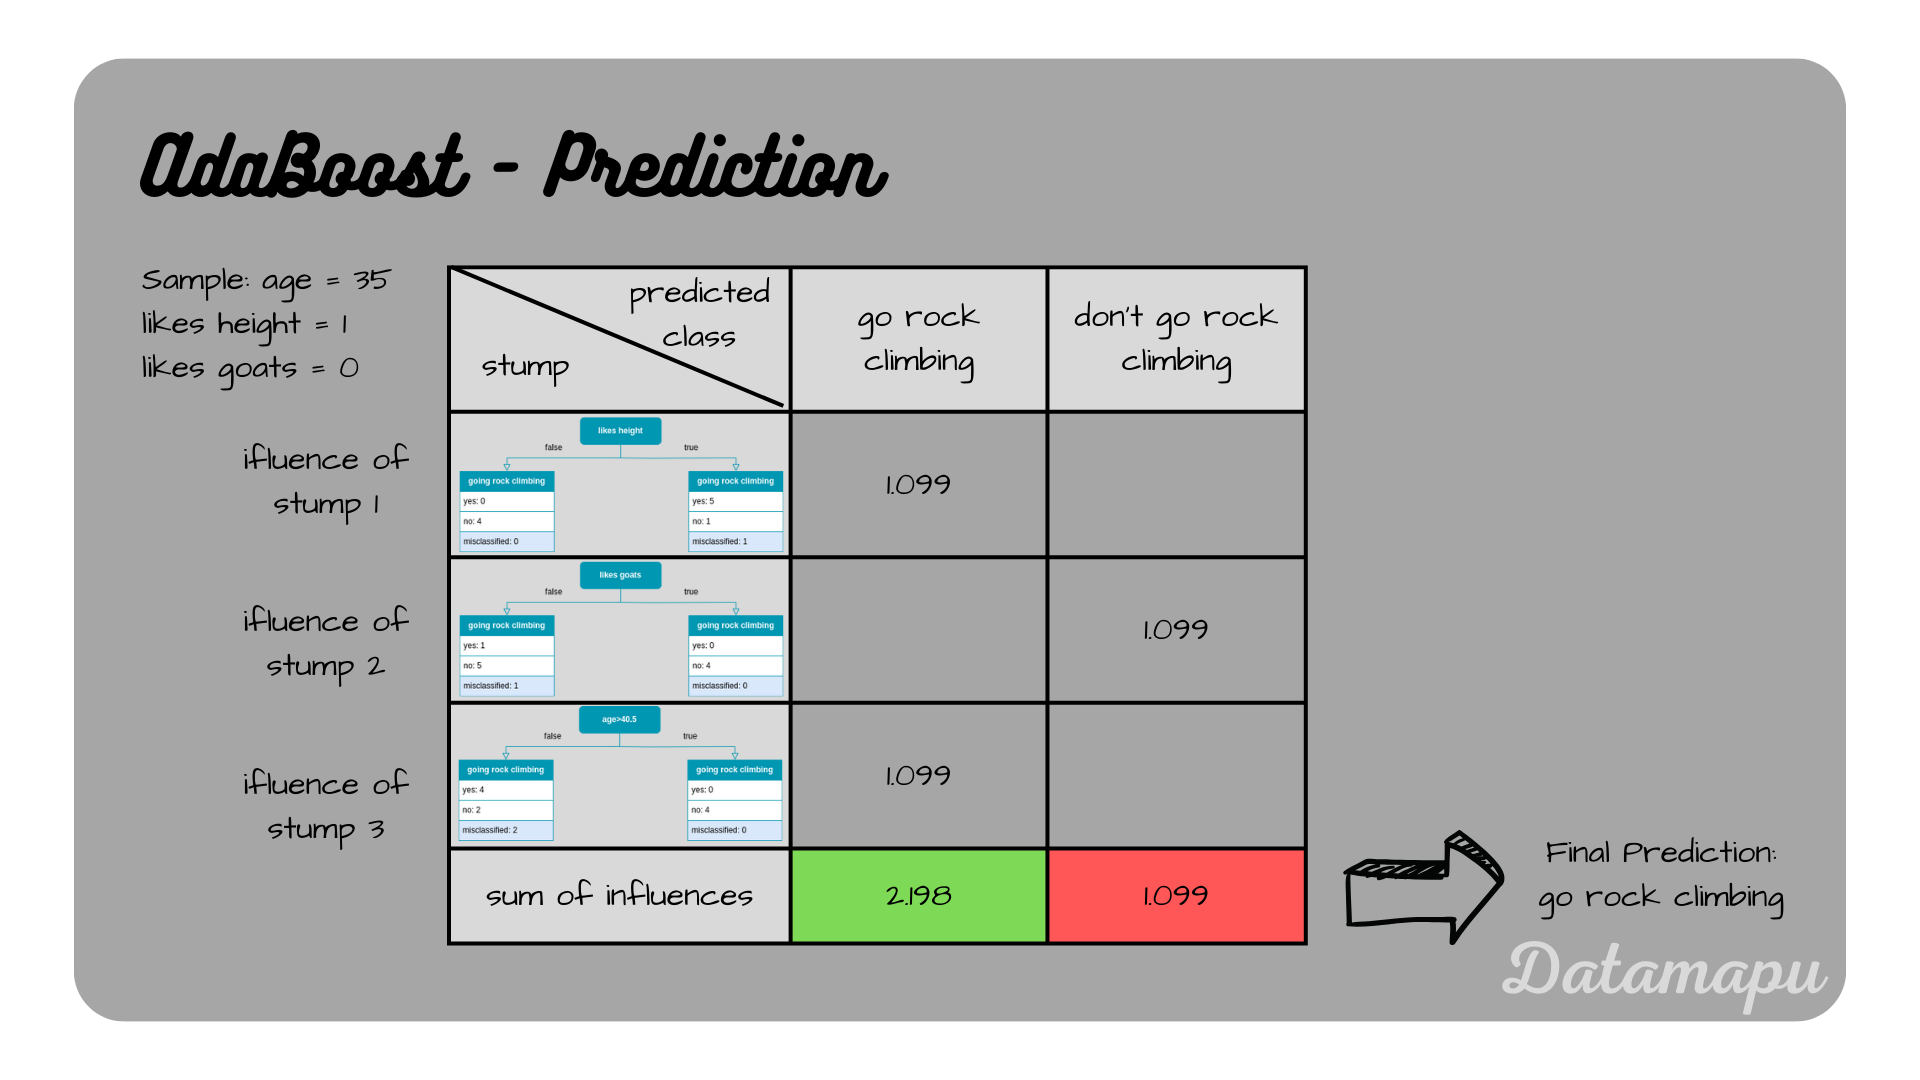 The predictions and their influences to determine the final prediction.
Fit a Model in Python
We now fit the example in Python using sklearn. Note, that the results are not exactly the same due to the randomness in the bootstrapping and the implementation algorithm of the estimators used in sklearn, which at the time of writing this post has the default value of SAMME.R. To fit a model, we first define our dataset as a data frame.
| |
We use the sklearn method AdaBoostClassifier to fit a model to the data. According to our example, we set the hyperparameter n_estimators=3, which means that three Decision Tree stumps are used for the ensemble model. Note, that for a real-world project, this hyperparameter would be chosen larger, the default value is $100$. The remaining hyperparameters are left as default values.
| |
To get the predictions, we can use the predict method method.
| |
For this example, the predictions are $[0, 1, 1, 0, 0, 1, 0, 1, 0, 1]$, which means that all samples are correctly predicted. We can also print the predictions and scores of the individual models. Please check the related article AdaBoost - Explained for some more details about this. A more realistic example with a larger dataset is provided on kaggle.
Summary
In this article, we illustrated in detail how to develop an AdaBoost model for a classification task. We used a simplified example to make the calculations easy to follow. We followed the most standard way of developing an AdaBoost ensemble model, that is the underlying base models were chosen as the stumps of Decision Trees. You can find a similar example for a regression task in the related article AdaBoost for Regression - Example and a detailed explanation and visualization of the algorithm in AdaBoost - Explained.
If this blog is useful for you, please consider supporting.
